
Satellite observations of snow have existed for decades, but until now, no dataset offered a consistent, almost gap-free daily record over a climatically meaningful period. A new dataset developed under ESA's Climate Change Initiative Snow project changes that: It provides the first continuous 45-year record of daily global snow cover, derived from observations spanning 1979 to 2023.
The dataset combines observations from 16 satellite sensors into a consistent record that captures not just whether snow is present, but what fraction of the ground it covers. For climate scientists, hydrologists, and water resource managers, this matters because snow cover directly shapes how much solar energy Earth absorbs, how much water flows into rivers and reservoirs, and how quickly permafrost thaws. Tracking these dynamics consistently over decades is essential to understanding how climate change is reshaping the planet's snow cover, and what that means for communities that depend on it.
The dataset is presented in the latest edition of the journal, Remote Sensing of Environment.
From binary to fraction: a more detailed picture of snow
Previous global snow cover records typically classified each area simply as "snow" or "no snow." But reality is more complex.
"Imagine you are on top of a mountain, looking down at a valley, and you have to decide for an area of 5 by 5 kilometres: is it snow or no snow? That's what a binary product does," according to Professor Stefan Wunderle from the University of Bern, the institution which led the research and is part of a larger project consortium. "But the challenge is: in that valley, there might be snow-covered meadows next to bare rock, forested slopes hiding snow beneath their canopy, and patches of frozen ground – none of which a simple yes-or-no classification can capture."
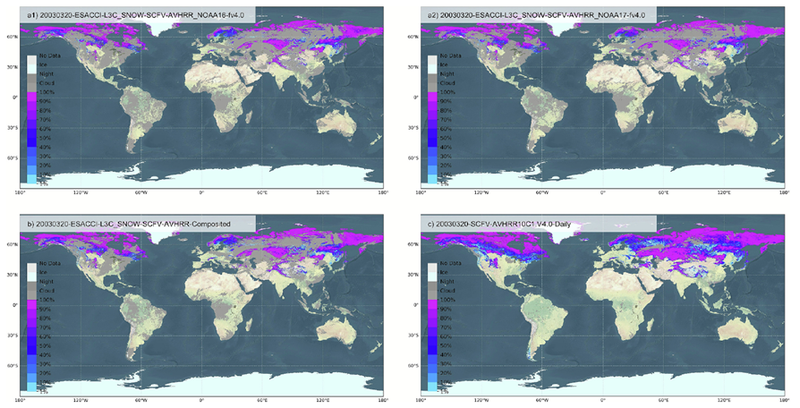
Instead of a yes-or-no answer, the dataset records the actual percentage of ground covered by snow in each grid cell – the snow cover fraction. But even that figure depends on the vantage point. In forested regions, tree canopies can obstruct a satellite's view, hiding significant amounts of snow below. The product therefore delivers two separate measurements: the snow fraction visible from above, and an estimate of what actually lies on the ground beneath the canopy. For a record spanning 45 years, this dual-layer approach is a unique capability.
Finally, the dataset offers gap-filled daily resolution. Earlier long-term records were typically available as weekly or monthly averages, which smoothed out the rapid changes that characterise snow cover, particularly during spring melt and autumn onset. Daily data allows researchers to track these transitions as they happen.
One record from 16 sensors
Building a consistent climate record from 16 different satellite sensors spanning 1979 to 2023 is a major technical undertaking. All satellites carried an AVHRR (Advanced Very High Resolution Radiometer) instrument, but as satellites gradually drift in their orbits over time, they each had different conditions for the observations. Based on EUMETSAT's AVHRR Fundamental Data Record (FDR), the University of Bern generated a daily and global snow time series considering all 16 NOAA and Metop satellite sensors. Afterwards, the team developed and applied a gap-filling approach, as described in the publication led by first author Dr Xiongxin Xiao.
Cloud cover which frequently blocks satellites’ view of the ground presented one of the biggest challenges. By combining observations from morning and afternoon satellite passes on the same day, and incorporating data from adjacent days, the research team was able to fill most gaps and produce a seamless daily record.
The role of snow in climate and water systems
Snow cover is a key variable in the climate system. Its high reflectivity, or albedo, means that snow-covered areas bounce back up to 80 percent of incoming solar radiation. When snow disappears earlier in the year, darker surfaces are exposed, absorbing more heat and accelerating regional warming. In northern latitudes, this can destabilise permafrost, releasing stored methane and creating a feedback loop that amplifies climate change.
Snow is also a vital water reservoir. In many parts of the world, seasonal snowmelt feeds rivers, replenishes groundwater, and supplies drinking water and hydropower. Changes in when and how quickly snow melts have direct consequences for water availability, flood risk, and energy production. A consistent, long-term dataset like this one allows researchers to track these shifts over time and provide more reliable projections for the future.
A new tool for climate research
The dataset is openly accessible: individual sensor data is available through ESA's Climate Change Initiative Open Data Portal, while the consolidated gap-filled daily composite product can be downloaded from Zenodo. The new dataset will be of high value for research teams and climate modelling groups seeking to incorporate the Essential Climate Variable 'snow cover fraction' into their work, but also for policymakers working on climate adaptation, water resource management, and flood risk assessment.
Early analyses already hint at what the record may reveal. "We have very high temporal and regional variability," says Wunderle. "One could expect that the warming would affect the snow cover distribution in an equal way. But that's definitely not true." Some areas experience unusually high snowfall even as others see rapid early-season melting, and these patterns can shift considerably in short time spans as well as from year to year. Understanding where, when, and why these shifts occur is exactly the kind of question a 45-year daily record can now help answer.