
14 april 2022
Comparing national GHG inventories with independent satellite observations
Study methodology could be used for monitoring the effectiveness of mitigation policy and progress by countries
A new study proposes a novel toolbox to compare and improve the consistency between inversions and UNFCCC national greenhouse gas inventory reports. If applied regularly in the coming years, the authors suggest that the proposed methodology could be used for monitoring the effectiveness of mitigation policy and progress by countries to meet their pledges towards the Paris Agreement.
The research, published in Earth System Science Data, describes how scientists working within the Regional Carbon Assessment and Processes (RECCAP-2) project, supported by ESA, combined satellite measurements of atmospheric carbon dioxide and methane, and in-situ measurements of nitrous oxide, with a model that factors in the movement or ‘flux’ of these greenhouse gases between the land surface and atmosphere.
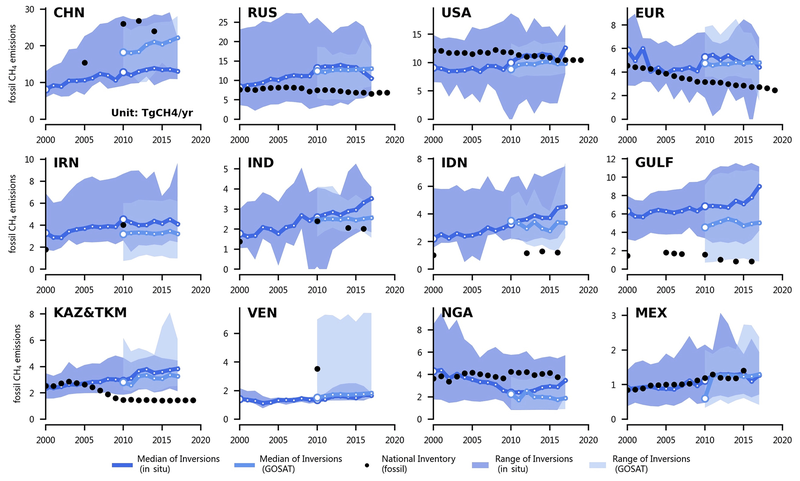
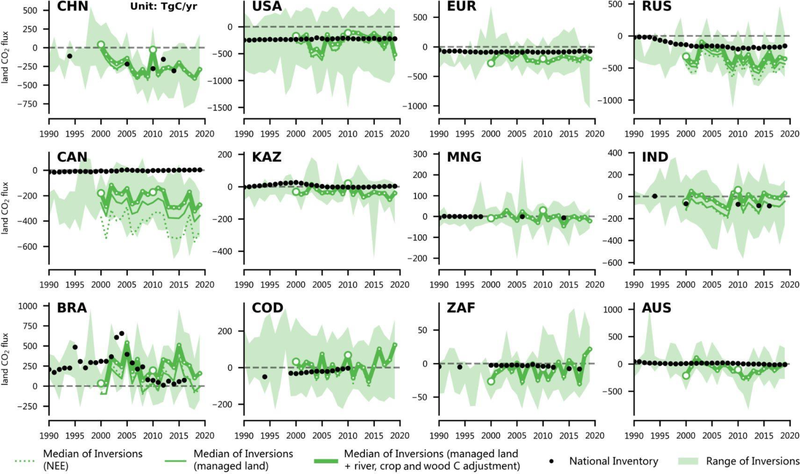
This ‘inversion method’ allowed the authors to determine emissions to the atmosphere of three greenhouse gases for a selection of high-emitting countries, as well as the overall flux of carbon dioxide over managed land. The managed land flux accounts for the absorption of carbon dioxide from the atmosphere due to the growth of crops and trees, their export and import across borders, and the anthropogenic component of rivers carrying carbon across borders, as well as carbon dioxide emissions from managed land owing to fires and other disturbances.
Significant discrepancies between these inversion values and the corresponding national reports were found.
Methane emissions were found to be higher using the inversion method compared to most national reports. In particular, emissions from oil and gas extracting states in Central Asia and the Gulf were several times higher than officially reported.
Absorbing 1.4 billion tonnes of carbon per year, the observed size of the global land carbon sink comprising ecosystems in both managed and unmanaged land, was several times larger than the 0.3 billion tonnes of carbon per year obtained by summing up countries’ reports.
Underreporting of this carbon sink was most evident for temperate and northern hemisphere countries, such as Canada and across the European Union.
In part, the disparity is explained by the carbon stored by unmanaged ecosystems that fall outside the inventory reporting protocol, while the full picture is observable from space.
With global temperatures having already risen by 1.1°C relative to pre-industrial levels, it is critical that policymakers have an accurate picture of emissions at both national and global scale.
Current guidelines used to compile national greenhouse gas inventories have their limitations. For example, they are usually based on scaled-up, sector-specific activity and rigid emission factors. Therefore, major emission sources, such as those from unmanaged land, fall out of scope. And, importantly, countries are only encouraged, but not required, to verify inventories against independently observed measurements.
In contrast, the new inversion method harnesses satellite data and in-situ observations to give a full picture of emissions that accumulate in the atmosphere.
Unlike national reporting guidelines, the inversion method captures seasonal and interannual extremes, such as drought and major wildfires, which are expected to increase in both frequency and severity as global temperatures ratchet upwards.
Philippe Ciais, from the Université Paris-Saclay, said, “The proposed method of using atmospheric inversions paves the way for countries and the global community to improve checks and consistency of national inventories to more accurately reflect global emissions.
“If regularly applied, this will not only improve transparency in the accounting process but will also improve the effectiveness of mitigation policy and progress by individual countries to meet their pledges as part of the Paris Climate Agreement.”
New satellite missions launched in the coming years will provide a much denser sampling of atmospheric carbon dioxide and methane. ESA is currently developing the Copernicus Anthropogenic Carbon Dioxide mission, which will be the first to measure how much carbon dioxide is released into the atmosphere specifically through human activity. The mission will provide the European Union with a unique and independent source of information to assess the effectiveness of policy measures, and to track their impact towards decarbonising Europe and meeting national emission reduction targets.
Find out more about the RECCAP-2 project