
10 mars 2023
Satellite ’archaeology’ provides record of 1970s sea ice development
Legacy sensor yields insight into previously unseen historic sea ice
A new sea ice concentration satellite data product, released as part of the ESA Climate Change Initiative, provides new insight into the development of global sea ice during the 1970s, which pre-date the existing data record.
Existing sea ice climate data records, albeit some of the longest available, only go back as far as 1979. However, using ’satellite archaeology’, a team of scientists from DTU working as part of the ESA CCI Sea Ice project harvested data from one of the earliest prototype satellite sensor datas to reveal reveal how sea ice formed in the early 1970s. The team achieved this by reprocessing observations from the Electrically Scanning Microwave Radiometer (ESMR) onboard the Nimbus-5 satellite, which launched from Vandenberg Air Force Base in California, in December 1972.
EMSR was a prototype that marked the start of microwave observations from space. Using data from this legacy mission, the research team was able to derive improved estimates of global sea ice concentrations and extent for the period 1972-1977, which predate sea ice climate data records derived from modern satellite radiometers which only start from 1979.
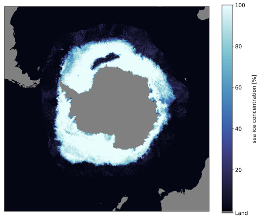
In contrast to modern multi-frequency radiometers, ESMR only measured brightness temperatures at a single channel and polarization (19 GHz horizontal polarization). Nevertheless, it proved the feasibility of microwave radiometry from space with unprecedented coverage and mapped features such as the Weddell Sea Polynya, which had not been mapped before.

Even though the single-channel ESMR was a prototype, it has the common heritage with modern sensors. This made it possible for the DTU scientists to reprocess EMSR’s primordial brightness temperature using today’s state-of-the-art processing algorithms to derive improved estimates of global sea ice concentrations and extent.
’Generating sufficiently long time series is an important goal to determine climate variability and change in polar regions. This latest work in effect extends the sea ice record by exploiting the satellite archive,’ says DTU’s Rasmus Tonboe, lead developer of the dataset.
’The calculated sea ice concentrations reveal features, such as the Weddell Sea Polynya, were more frequent and larger in extent than they are today. Extending the sea ice record into the past gives thus insights into detailed changes in sea ice formations before the beginning of the 80s,’ adds dataset co-author, Wiebke Kolbe.
The Nimbus-5 ESMR Sea Ice Concentration (v.1.0) can be accessed and downloaded from the CCI Open Data Portal and is the latest addition to the ESA Climate Change Initiative sea ice datasets, which provides an interesting reference to the 1970s, since current sea ice climate data records go back to 1979.
The dataset contains sea ice concentrations and associated uncertainties at a 25 km grid resolution.
Polar sea ice is both an indicator and a driver of global climate. It affects ocean circulation, weather, and regional climate and has decreased significantly since the records began. Reflecting its importance, sea ice is considered to be one of 55 Essential Climate Variables recognised among science and policy communities that are used to characterise Earth’s climate.