
Related links
The links here relate to the CCI Sea Level project.
See the : animation of the ESA coastal Sea Level virtual stations.
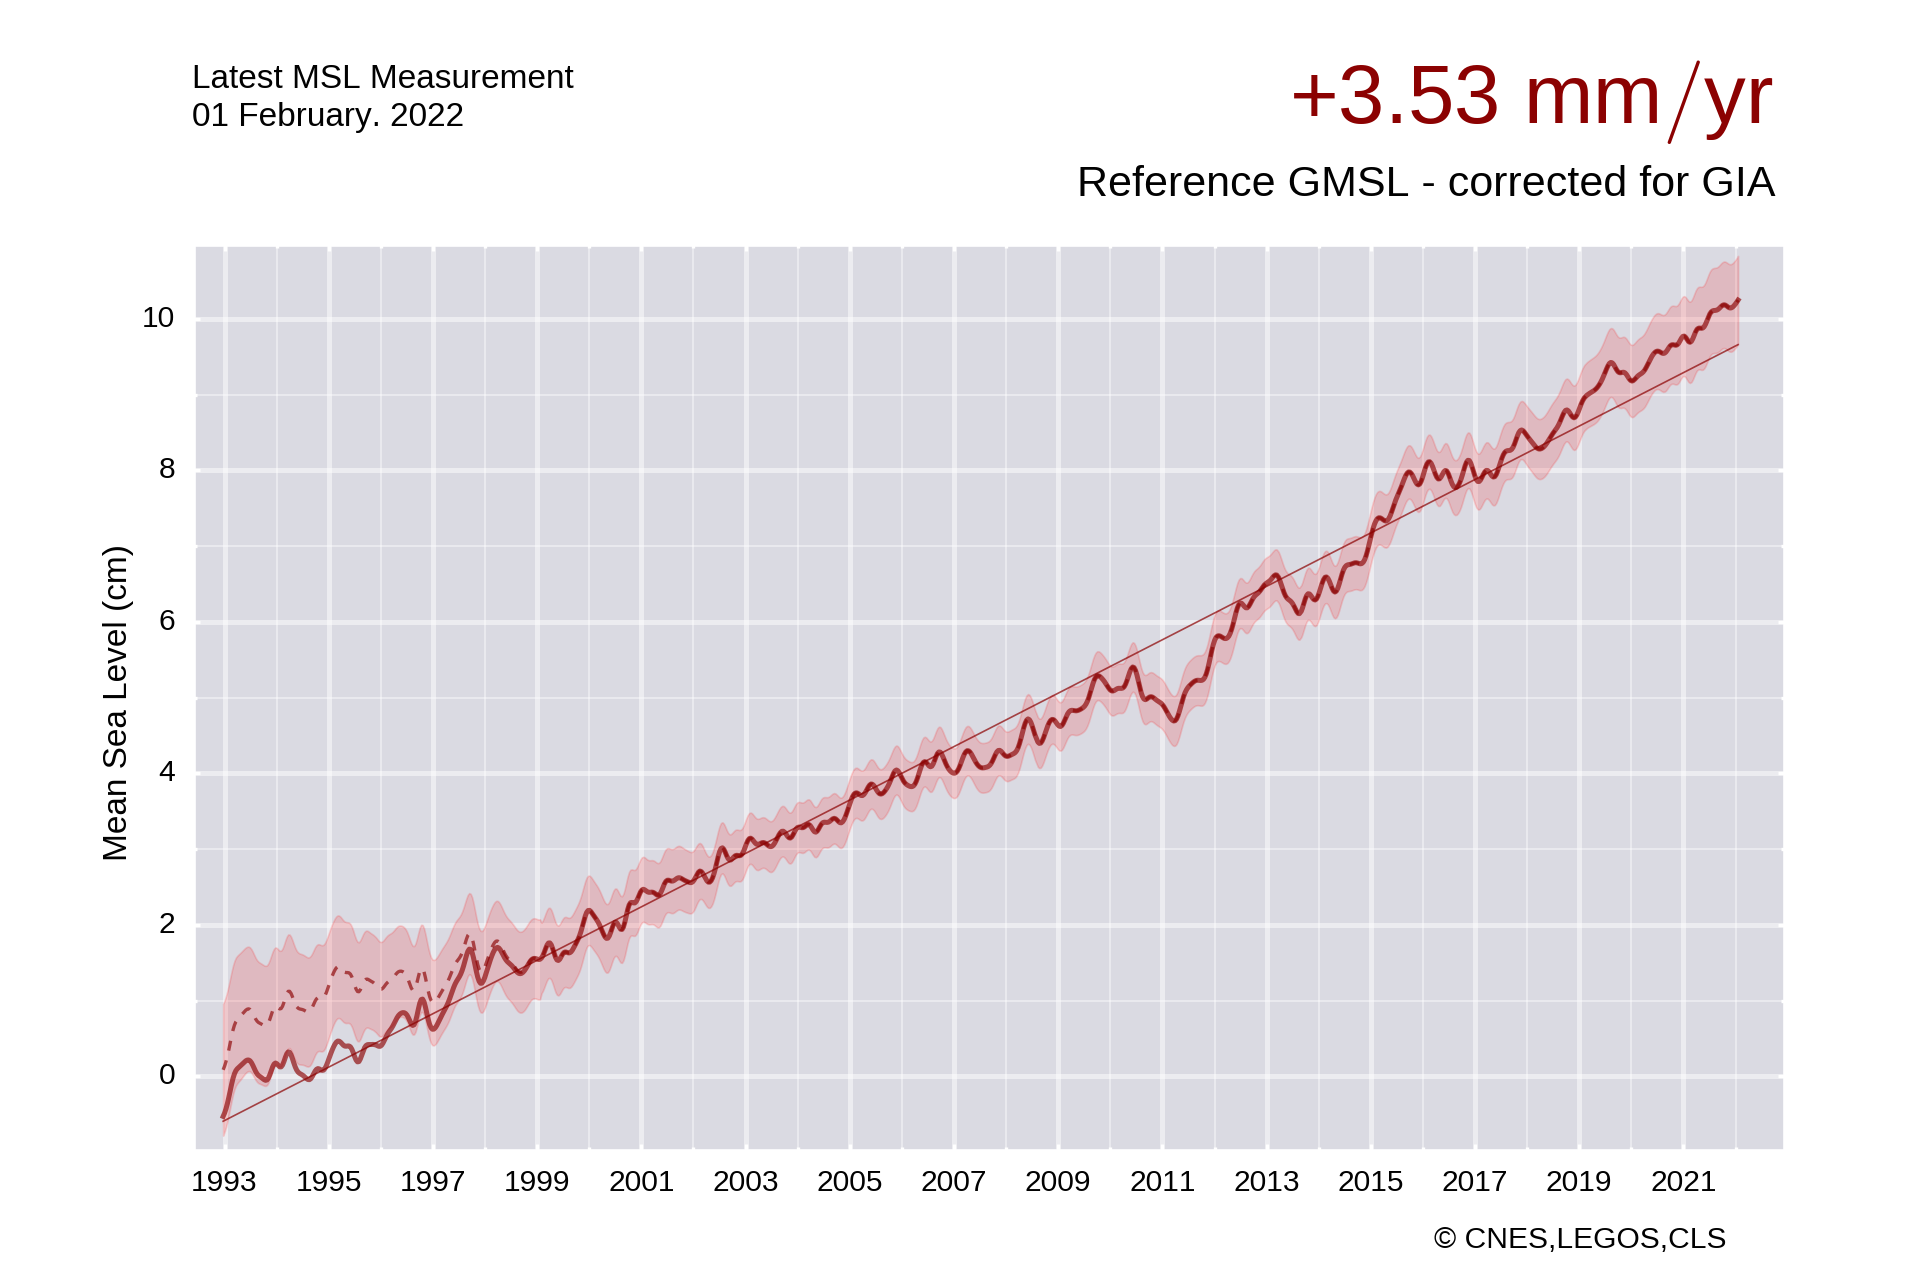
A little picture reveals the global mean sea level trend
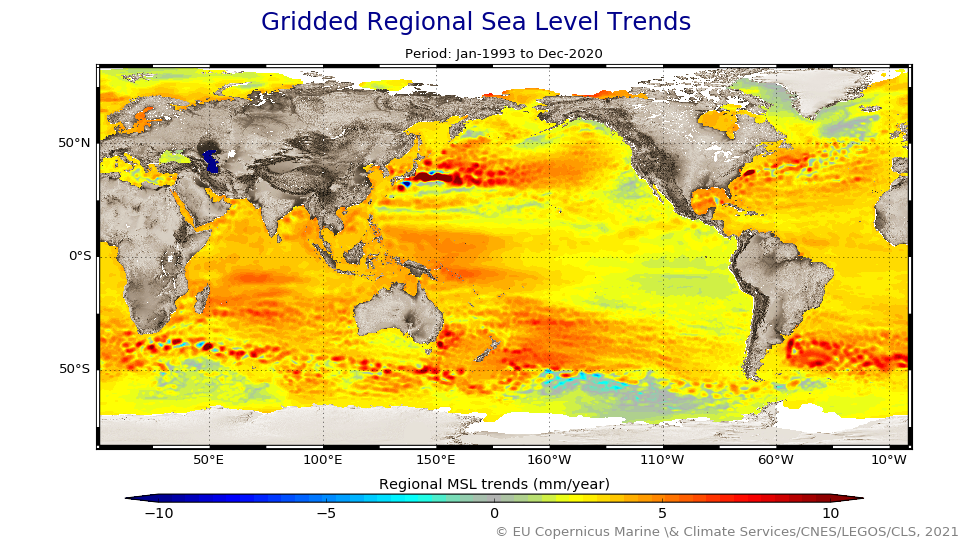
Mean Sea Level by Altimetry (Aviso/Altimetry, Cnes), providing the access to the Global Mean Sea Level time series and the map of regional Mean Sea Level trends:
Information related to altimetry: http://www.altimetry.info/toolbox
- Mean Sea Level (University of Colorado)
- Sea Level indicator of global climate change (Nasa/JPL)
- Sea Level Rise (CEOS Case studies: Satellite observations in support of climate challenges)
- Sea Level Rise (CSIRO)