
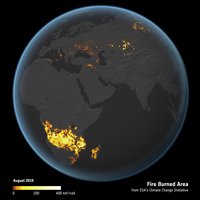
Fire affects an estimated four million square kilometres of Earth’s land each year and is responsible for releasing aerosols and greenhouse gases to the atmosphere. Understanding the influence that this has on atmospheric chemistry and representing these emissions in future climate predictions is, however, complex and remains poorly understood. To improve the situation, a team of scientists working as part of ESA’s Climate Change Initiative is using satellite observations, such as from Copernicus Sentinel-3, to gain a global view of land burned by fire.
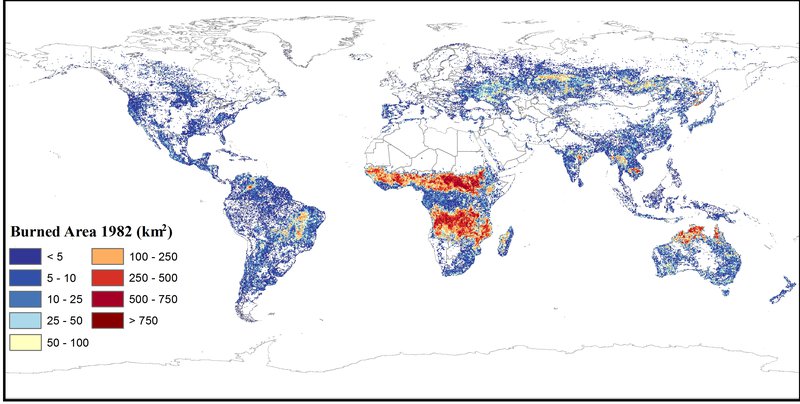
Used alongside land-cover information, for example, savannah or forest, maps of burned area derived from satellite data help to improve fire-emission inventories to quantify the impact of fires on air quality, climate and its critical component, the global carbon cycle.
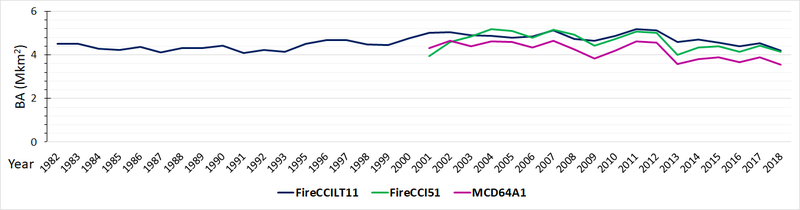
The current focus of the team, led by Emilio Chuvieco from the University of Alcalá in Spain, is to merge data from Copernicus Sentinel-3’s Ocean and Land Colour Instrument (OLCI) and its Sea and Land Surface Temperature Radiometer (SLSTR) into their existing global burned area product, FireCCI51 (2001–19).
Using Sentinel-3 allows the time series to continue to be extended in time while also improving accuracy, which, in turn, better supports scientists modelling the climate, vegetation and the atmosphere.
Prof. Chuvieco explains, “Shortwave-infrared data from Sentinel-3 is particularly beneficial and should help to discriminate between burned area and other low reflectance covers, while improving the accuracy obtained with FireCCI51, which is derived from near-infrared bands from the older Moderate Resolution Imaging Spectroradiometer (MODIS) sensor on NASA’s Terra and Aqua satellites.
“We expect to have a first assessment of these new products by the end of the year.”
A key demand of the climate modelling community is the production of a burned area time series that exceeds 30 years. The team has addressed this by releasing a multidecade time series, called FireCCILT11, using historic satellite observations from the Advanced Very High Resolution Radiometer on NOAA’s series of Polar Orbiting Environmental Satellites.
This is the first attempt to generate a global burned area dataset using this sensor and provides a 36-year time series, from 1982 to 2018 – almost double the time covered by MODIS-based products.
The FireCCILT11 is offered as grid and pixel products, and the pixel data have a 0.05 degree resolution, which approximates to a relatively coarse five kilometres. While including higher uncertainties than products based on MODIS data, it extends the existing burned area time series backwards by almost 20 years.
“The longer time period of this new product offers climate, vegetation and atmospheric modellers, as well as fire researchers and fire managers interested in historical burn patterns, the ability to analyse decadal trends. Having longer time series enable scientists to detect changing fire disturbance patterns, particularly from extreme events, such as those recently produced in Australia and Western USA,” said Prof. Chuvieco.
ESA’s Climate Change Initiative generates accurate and long-term satellite-derived datasets for fire and a suite of other Essential Climate Variables to help characterise the evolution of the Earth system.
The global burned products FireCCI51 and FireCCILT11 can be accessed from the ESA Climate Change Initiative Open Data Portal.