Sea level is a very sensitive index of climate change and variability. As the ocean warms in response to global warming, sea waters expands and as a result, sea levels rise. When mountain glaciers melt in response to increasing air temperature, sea levels rise because more freshwater glacial runoff discharges into the oceans.
Similarly, ice mass loss from the ice sheets causes a rise in sea level. The increase of freshwater flowing into the oceans reduces its salinity, decreasing its density and affecting ocean circulation patterns that in turn affect the sea level and its spatial variability.
The global mean level of the oceans is an indicator of climate change. It incorporates the reactions from several different components of the climate system. Precise monitoring of changes in the mean level of the oceans is vitally important for understanding not just the climate but also the socioeconomic consequences of any rise in sea level.
Mean sea level is an average over all the oceans of sea surface height, with respect to a reference. However, what are really sought are the variations of this mean sea level along time. For almost 30 years now, the global mean sea level has been routinely measured over the whole oceanic domain with high-precision satellite altimetry, and such observations show clear evidence of global mean sea level rise (+3.4 +/-0.4 mm/yr).
This mean sea level can be global, but basins (e.g. Atlantic) or regional areas can be computed. The rise in the sea level of the oceans is far from uniform. In fact, while in certain ocean regions the sea level has risen (by up to 20 millimetres a year in places), in others it has remained unchanged or has even fallen. These regional differences, observed by altimetry satellites, mostly reflect sea level fluctuations over several years.
Consequences
A large proportion of the world’s population lives in coastal areas vulnerable to rising sea level. Permanent submersion, repeated flooding, faster erosion of cliffs and beaches and increasingly saline estuaries and salt contamination of groundwater are just some of the possible consequences of a big rise in the sea level near low-lying regions.
The main objective of the sea level CCI project is to produce and validate a Sea Level Essential Climate Variable (ECV) product.
To achieve this global objective, the specific objectives for the Sea Level ECV are:
- To involve the Climate research community and to improve the understanding of this community's needs and thus ensure a perfect consistency between the need and the future development and improvement of the altimeter processing system. A clear gap exists between the requirements expressed by the CGOS and the current status of the altimeter sea level error budget. Consequently, the user consultation carried out during the project is an important step to revisit and to precise these requirements in order to find a consensus between the Climate Research and the Earth Observation communities. The User Requirement Document presents a synthesis of this work.
- To develop, test and select the best algorithms and standards in order to produce high quality sea level products for climate applications. These activities have allowed the altimeter community to work on the development of climate optimised processing algorithms. A large spectrum of algorithms and methods have been assessed during the project and the more relevant for climate applications have been selected. The Round Robin Reports produced within these activities are all available for the users.
- Assess and collect information on the quality and error characteristics of the Sea Level ECV product through the involvement of independent climate research groups. The main objective here is to obtain relevant feedback from the user community in order to qualify the accuracy and suitability of the ECV products and to define new suggestions for improvement. It is also the opportunity to implement an in-depth dialogue between the climate research and Earth Observations communities which is fundamental to address climate change issues.
- Provide a complete specification of the operational production system.
Focus on the current SL_cci achievements
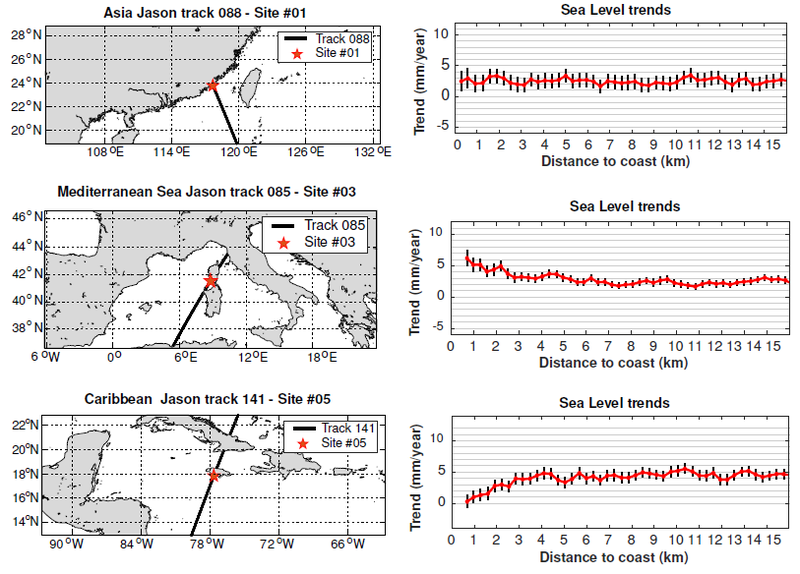
The current phase of the project focuses on the estimate of the sea level close to the coast in order to assess whether the sea level trends at the coast are similar to what can be observed further offshore in the open ocean.
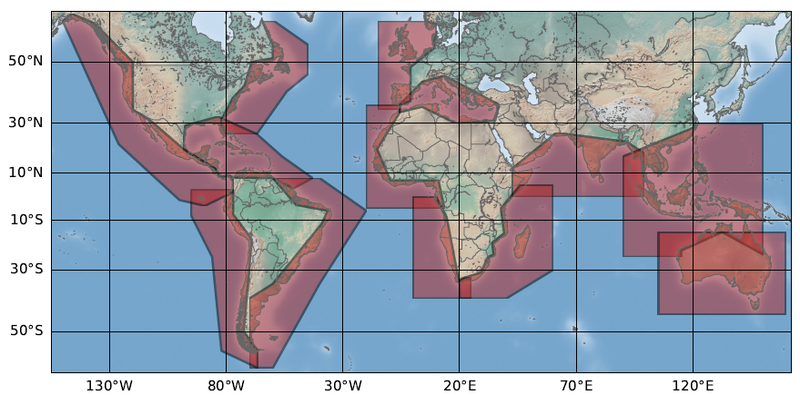
Reprocessed altimeter 10-day Sea Level Anomalies have been computed in all the coastal regions illustrated below.
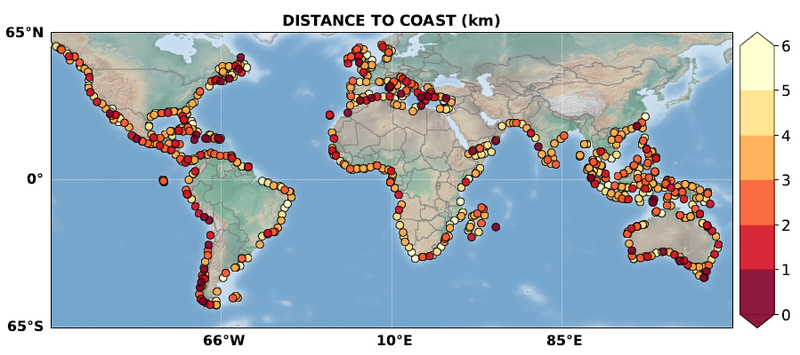
Then, further validation and editing have led to the production of the v2.1 dataset of monthly sea level anomalies and associated trends at 756 selected coastal sites located in almost all the world coastal ocean (see below) covering 2002-2020.
SEE THE ANIMATION OF COASTAL SEA LEVEL VIRTUAL STATIONS
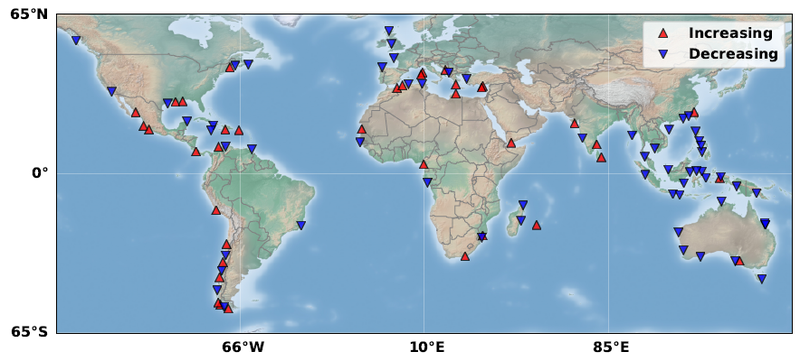
The mean sea level trends observed at the 251 virtual stations located at less than 3.5 km from the coast are shown below during 2002-2020, superimposed with the C3S sea level trends during the same time span.
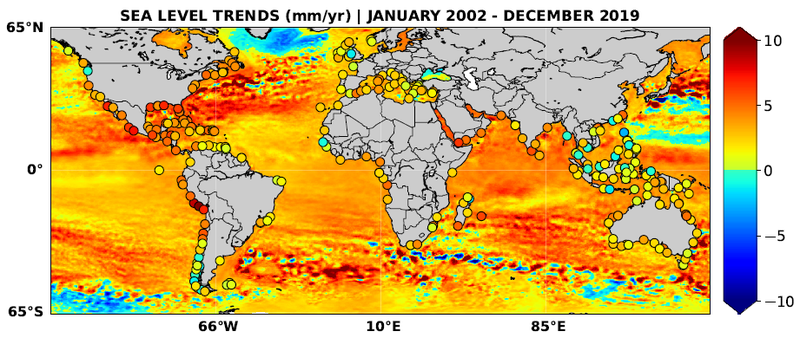
In more than 80% of cases, the sea level trend at the coast is similar to the open ocean trend (considered here at a distance of 15 km from the coast). In the other 20%, we note smaller trend than offshore for ¾ of the sites. This is particularly seen in the southeast Asia region. The remaining sites show slightly larger trends in the last few km to the coast compared to the open ocean. Illustration of the different trend behaviours is presented below as well as a map synthsizing the results.
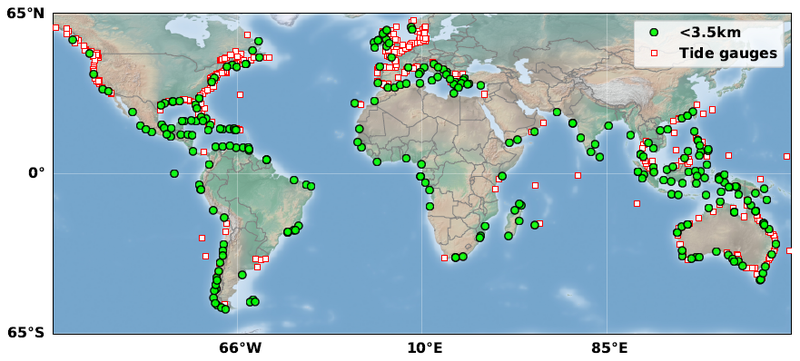
The network of virtual coastal stations proposed here should be of invaluable interest for estimating present-day (absolute) sea level rise along the world coastlines, especially in regions devoid from in situ tide gauges. This is illustrated below with the distribution of the 271 virtual stations located within 3.5 km from the coast and of current tide gauges that have monthly sea level data over the study time span (with not more than 24 months of missing data).