Description
This Study is led by Jean-Christophe Calvet from Météo-France.
The main CCI ECVs used in this Study are Land Cover, Land Surface Temperature, Soil Moisture, and Snow.
This Cross-ECV climate science study is dedicated to assessing the impact of integrating CCI land cover (LC) data in Météo-France's Interactions between Soil, Biosphere, Atmosphere (ISBA) land surface model. The study aims to evaluate the effect of updating land cover information in ISBA using CCI LC products in the SURFEX modelling platform of Météo-France, which incorporates the ISBA model, on simulated soil moisture (SM), land surface temperature (LST) and snow water equivalent (SWE). The CCI Snow Water Equivalent, Soil Moisture and Land Surface Temperature products are used as a benchmark. The study focuses on Eurasia with a spatial resolution of 0.25° x 0.25° between 2010 and 2022.
Results
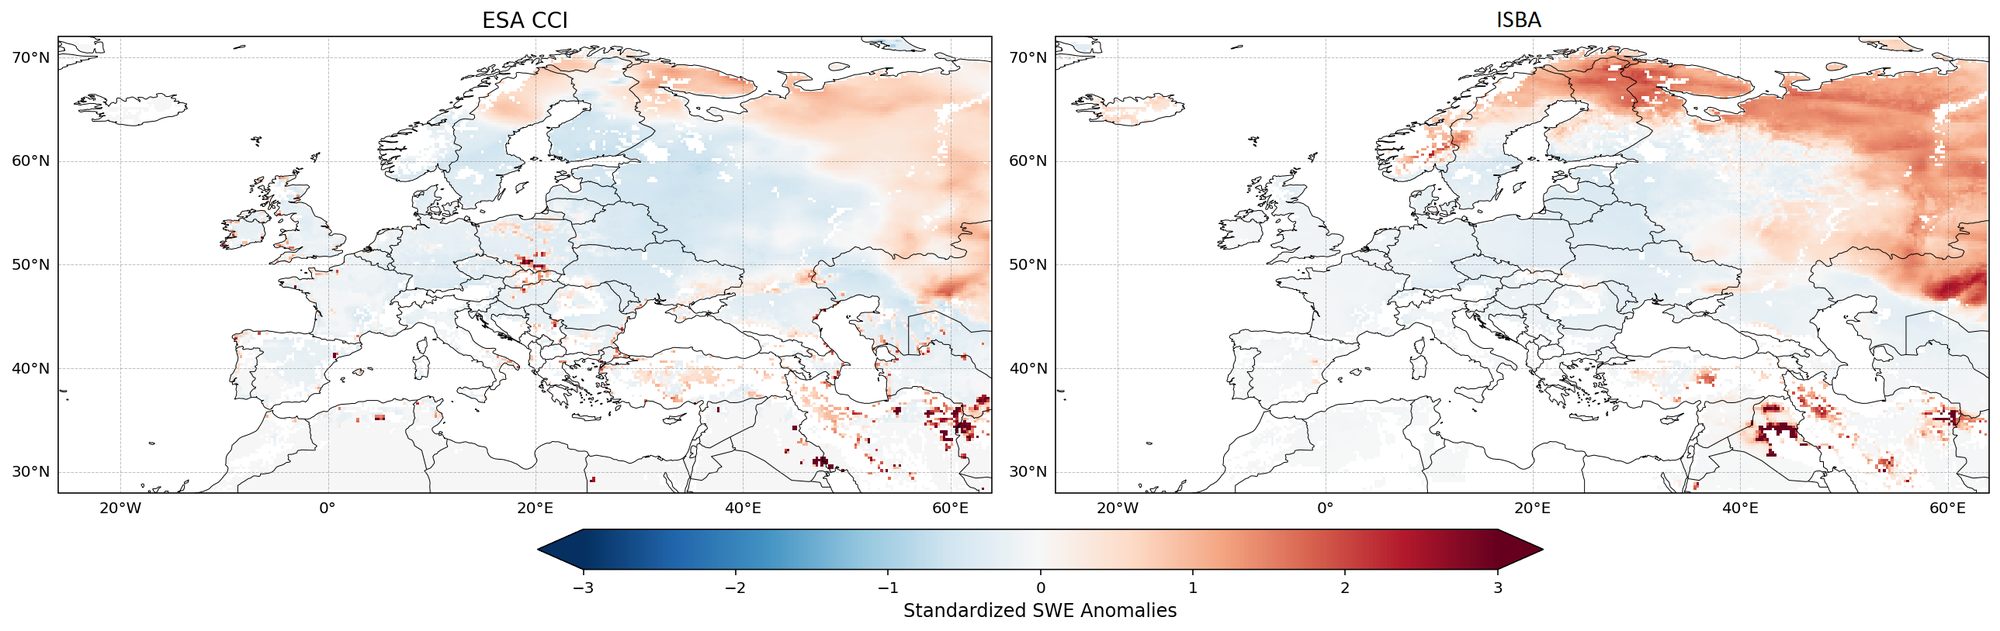
Although ISBA tends to overestimate SWE, the simulated SWE anomalies are consistent with observations. Figure shows the z-score scaled anomalies of the simulated and observed SWE for the warm winter of 2020, for which a large model bias is evident. While most of the domain exhibits a negative SWE anomaly in 2020, a positive SWE anomaly is evident in the north-eastern part of the domain. Over the entire time period, the use of CCI LC significantly reduces the root mean square difference between ISBA simulations and CCI SWE observations.
Conclusions
Although ISBA tends to overestimate SWE, the simulated SWE anomalies are consistent with observations. Figure shows the z-score scaled anomalies of the simulated and observed SWE for the warm winter of 2020, for which a large model bias is evident. While most of the domain exhibits a negative SWE anomaly in 2020, a positive SWE anomaly is evident in the north-eastern part of the domain. Over the entire time period, the use of CCI LC significantly reduces the root mean square difference between ISBA simulations and CCI SWE observations.