
3. April 2024
High-resolution maps reveal ‘real-world’ land-use change
New maps reveal small-scale land processes to support land-based GHG emissions estimation and climate modelling
Global estimates of land use and land cover change are indispensable for quantifying greenhouse gas exchange between the land and the atmosphere and aiding national emissions reporting in support of the UNFCCC Paris Agreement. Yet, at 100 m resolution existing maps often fail to detect small-scale deforestation activities, agriculture, or the growth of new settlements, potentially leading to significant errors.
Now, newly released long-term high-resolution maps are helping to resolve the situation. Developed by researchers from ESA's Climate Change Initiative, these satellite-derived products offer a tenfold improvement in the ability to accurately estimate land cover and land use changes at the subcontinental/regional scale.
Mapping land cover and land and cover change
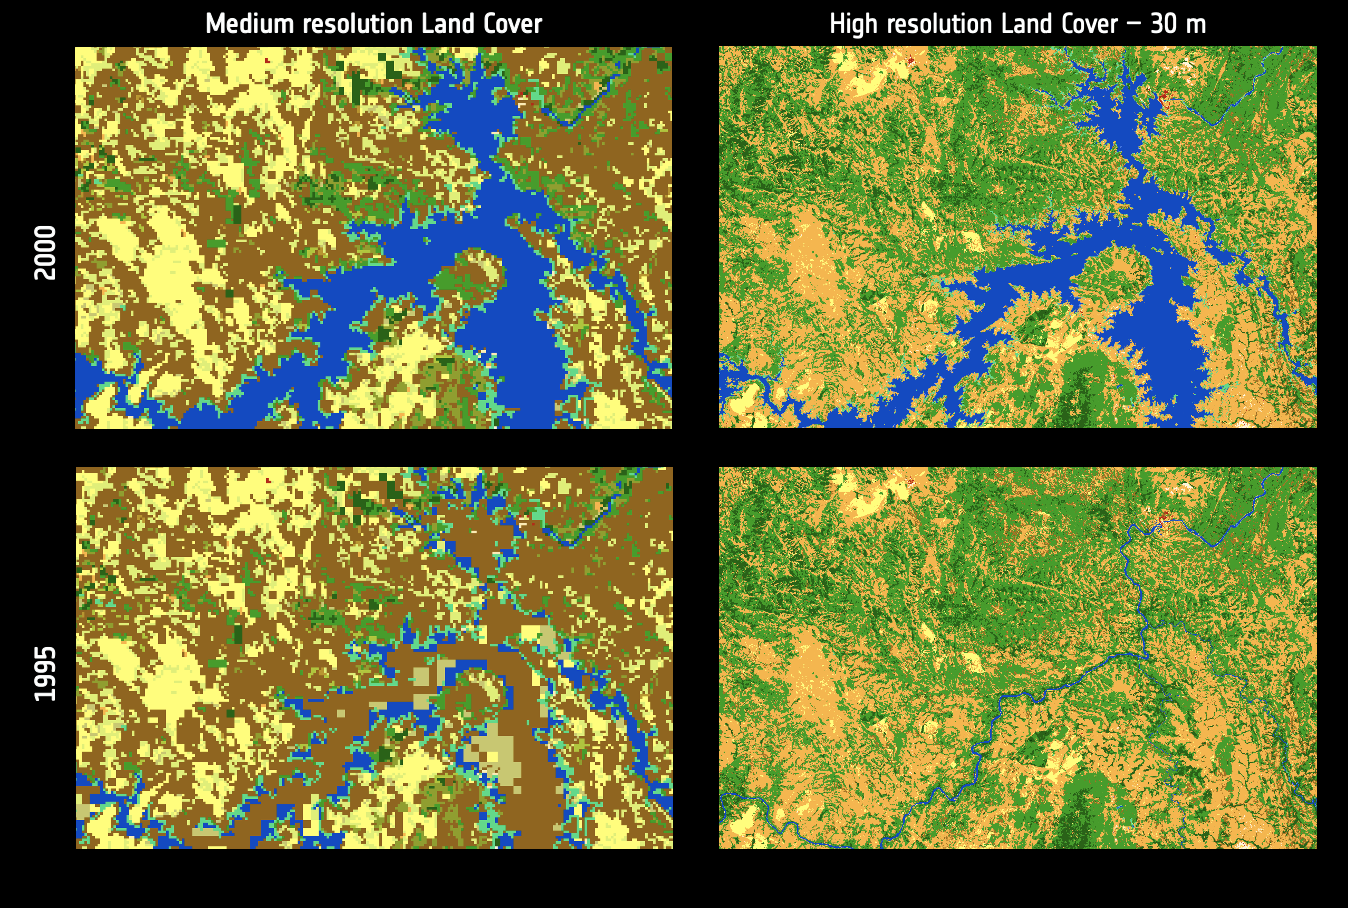
The new products include a static 10 m resolution map for 2019 as well as 30 m maps that trace annual land use and cover changes between 1990-2019 that will support climate modelling investigations into the role of land cover and land cover changes.
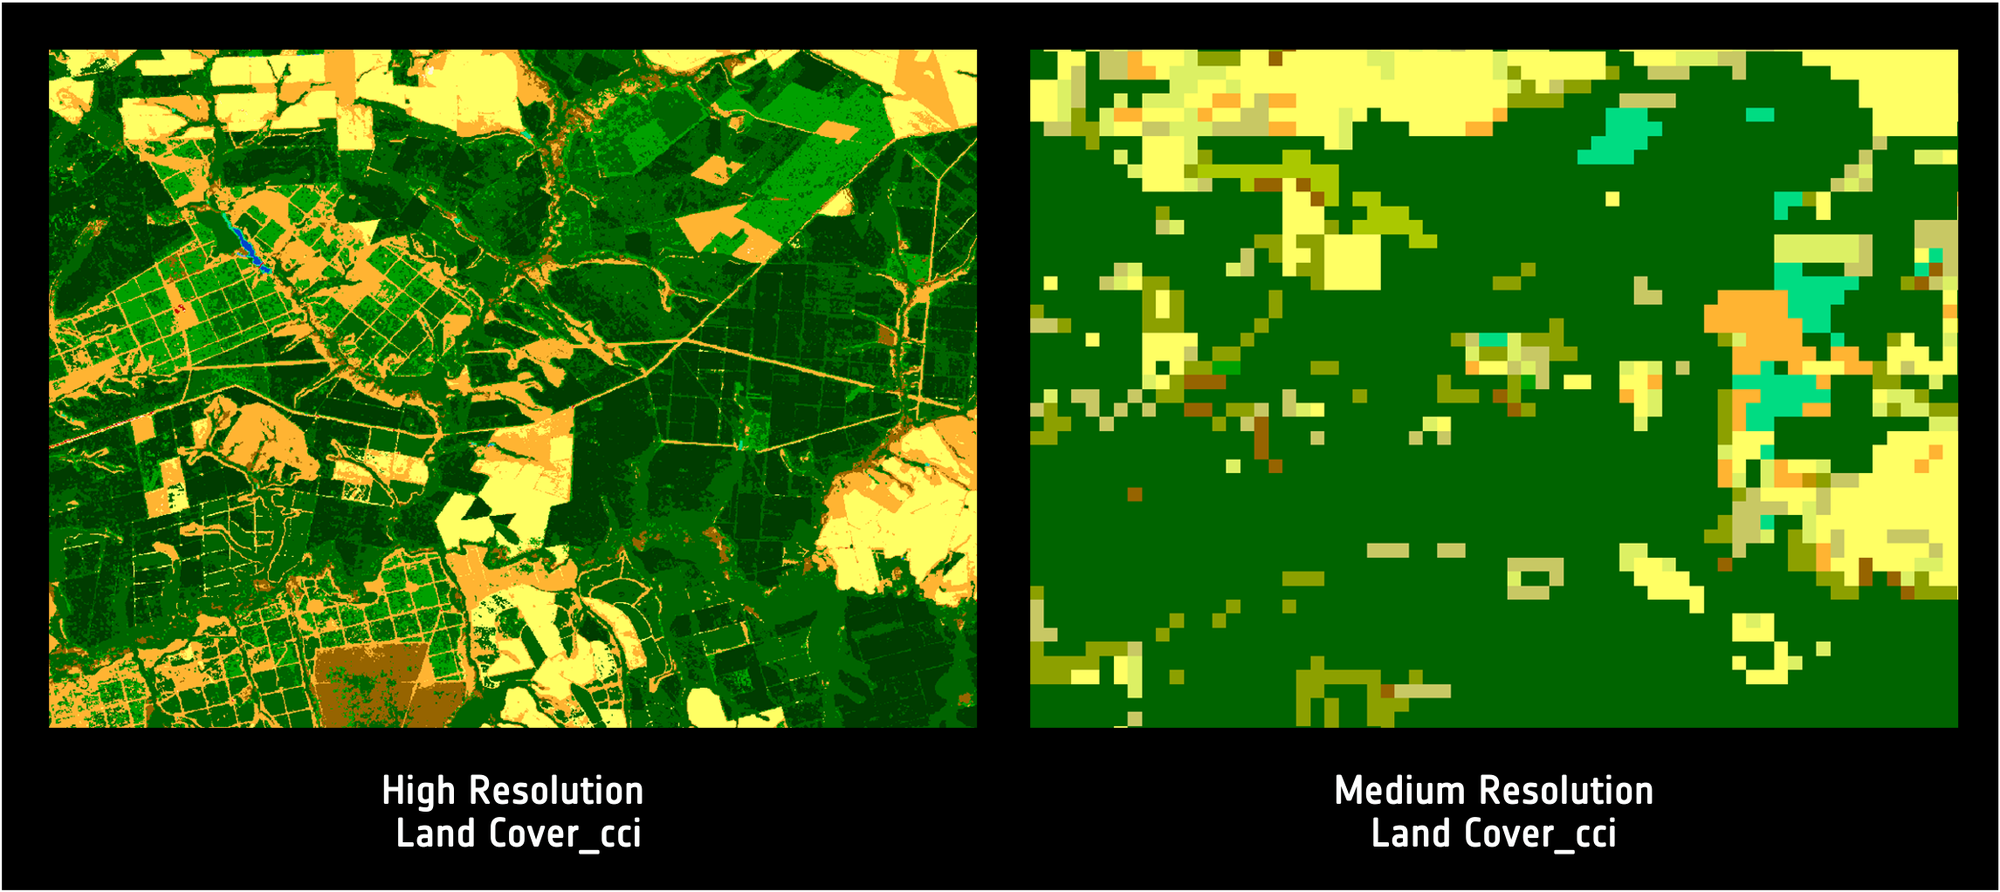
‘The new maps are particularly relevant for studying regional and local land change patterns that are not detected in medium resolution products,’ explains Lorenzo Bruzzone of Trento university, and science leader on the ESA Climate Change Initiative's High Resolution Land Cover project (HRLC_cci).
‘In effect, changing resolution changes the proportion of land-cover types identified in a given region and results in mapping land use change that more accurately reflects the real-world situation.’
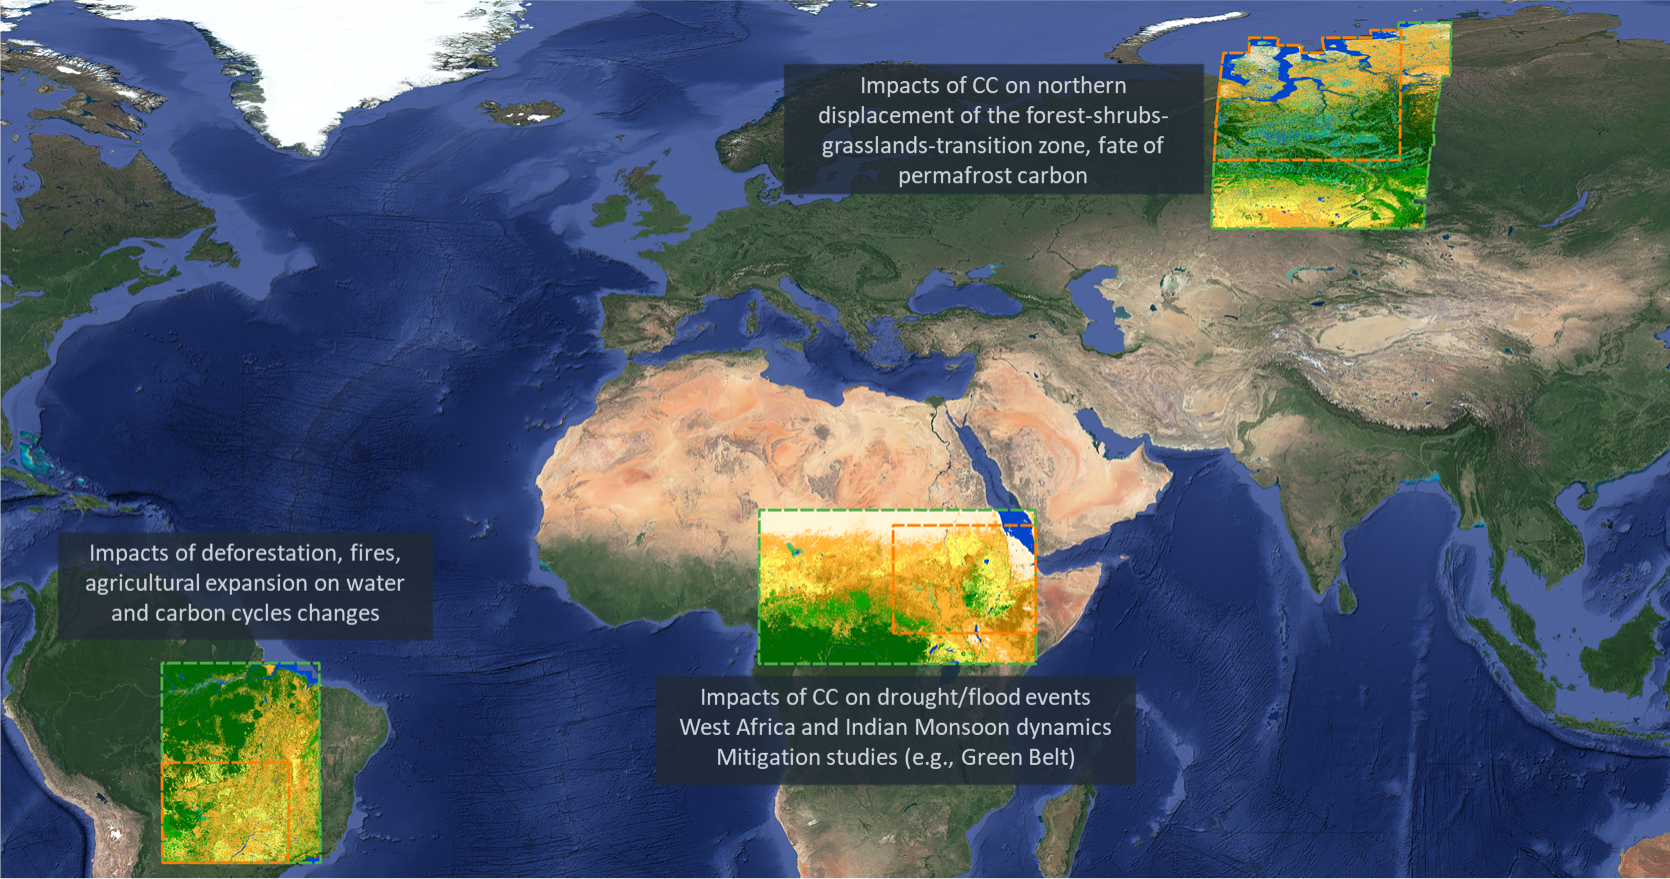
Currently the maps are restricted to three sub-continental regions – Amazon, African Sahel, and Siberia. Chosen in consultation with the climate modelling community the areas provide a diverse range of ecosystems, climatic conditions and latitudes and support on-going studies that are addressing complex land-based feedback relating to deforestation, extreme events, and climate change adaptation.
The maps, adapted from the FAO Land Cover Classification System, include 16 land cover classes essential for efficient assimilation of data into climate models, facilitating the study of water and carbon cycles. For example, deciduous and ever green tree cover, crop lands, and built environment.
These finer-resolution maps offer great potential for investigating regional carbon cycling, carbon budgeting, and monitoring trends in natural capital or conservation projects.
Interactive viewer: ESA CCI High Resolution Land Cover Change maps
You can view temporal land cover change at 30 m resolution for the years 1990-2019 for the Amazon, African Sahel, and Siberia areas.
According to ESA climate applications scientist, Clement Albergel the maps are set to support implementation of the UNFCCC Paris Agreement and the global stocktake, ‘Parties to the UNFCCC are required to submit statistics on anthropogenic GHG emissions and removals in three categories, including emissions and removals arising from changes in land cover in managed landscapes. Understanding the role of land for storing carbon and its future potential for offsetting carbon emissions is paramount to track effectiveness of progress towards a sustainable future. Modelling the interactions between vegetation, climate and greenhouse gases is supported by datasets such as those from the ESA Climate Change Initiative's High Resolution Land Cover project to quantify change consistently across countries.’
Overcoming technical and computational challenges, the project team integrated data from various sensors – including the Copernicus Sentinel-1 and -2, Envisat, ERS-1 & -2 – and employed machine learning in processing chains to deliver consistent and harmonised map-based products.
Professor Bruzzone explains: ‘Combining data from multiple missions is needed to realise long-term, decadal record required for climate research. This also brings advantages by reducing inconsistencies or limitations of any single dataset.’
Research and climate model ready
The fully validated maps, consisting of 93 billion labeled samples, are accessible in geotiff format at climate.esa.int/data. Uncertainty information is provided alongside the map products to support assimilation of the data into climate and land/atmosphere models.
Next steps for the HRLC_cci project involve upgrading the processing chain and machine learning algorithms to extend coverage and improve scalability.
ESA CCI High resolution land cover and land cover change maps version 1.2
Africa (Eastern Sahel region):
- Land Cover maps at 10m spatial resolution - 2019
- Land Cover and Land cover change maps at 30m (1990-2019)
Geographic range (3.5°N – 16.3°N; 27.0°E – 43.3°E).
Amazonia (Eastern Amazonas region):
- Land Cover maps at 10m spatial resolution - 2019
- Land Cover and Land cover change maps at 30m (1990-2019)
Geographic range (23.6°S – 11.7°S; 46.7°W – 62.1°W).
Siberia (Northern Siberia region):
- Land Cover maps at 10m spatial resolution - 2019
- Land Cover and Land cover change maps at 30m (1990-2019)
Geographic range (59.4°N – 73.9°N, 64.8°E – 87.4°E).