
Description
Robert King, Debbie Hemming, Rebecca Holliday (Met Office)
Daniele Peano, Matteo Mastropierro (CMCC)
Plants play a vital role in exchanging water, carbon and energy between the atmosphere and the land surface. Understanding the influences on vegetation growth cycles is essential for accurately representing ecosystems in climate models and for developing strategies to mitigate climate change driven by rising CO₂ levels. One approach for monitoring vegetation is through satellite observations, such as Leaf Area Index (LAI), which estimates the amount of green leaf surface area present as the one-sided green leaf area per unit ground area in broadleaf canopies, and as one-half of the total needle surface area per unit ground area in coniferous canopies.
State-of-the-art land surface models commonly use LAI to scale up leaf-level processes, such as photosynthesis, to the canopy and broader spatial scales. Understanding the relationship between LAI and other physical quantities such as Land Surface Temperature (LST) and soil moisture, is therefore an important step in climate modelling. LAI can also be used to derive a range of phenology metrics that describe the growing season, including the onset of vegetation growth, the length of the growing season, and the timing of peak of growth. These metrics can be combined with other essential climate variables (ECVs) such as LST, soil moisture, above ground biomass (AGB), and snow cover, to better understand vegetation processes occurring across a region. This includes assessing plant health, monitoring recovery from extreme events like droughts and heatwaves, tracking crop development, and evaluating how well these processes are represented in climate models, such as those used in CMIP6.
The European Space Agency (ESA) Climate Change Initiative (CCI) LAI data (CCI_LAI) is a new, high-resolution product derived from multiple satellite platforms. It provides LAI observations every five days at a 1 km spatial resolution along a north-south transect extending from Scandinavia to South Africa (10ºE-30ºE - 75ºN-35ºS). Researchers at the Met Office and Fondazione Centro Euro-Mediterraneo sui Cambiamenti Climatici (CMCC) are working to explore and apply this new dataset to better understand vegetation processes through the CCI_LAI dataset and its links to other CCI products.
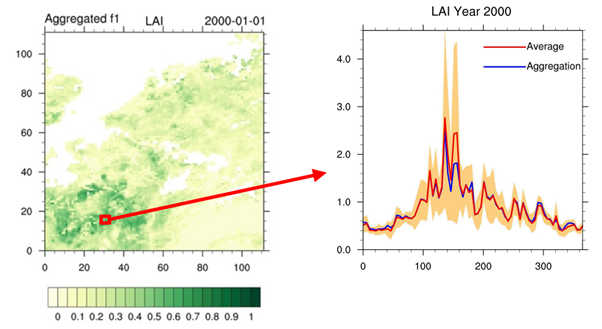
Initial work with the CCI_LAI dataset focused on developing methods to take advantage of its high temporal resolution and to aggregate the LAI values over larger areas, such as biome-representative regions. This involved using the uncertainty information provided in the dataset to calculate weighted averages of LAI across regions. It also required filtering the data based on the quality flags that indicate the reliability of each LAI retrieval. An example of the impact of aggregating the LAI data is shown in Figure 1.
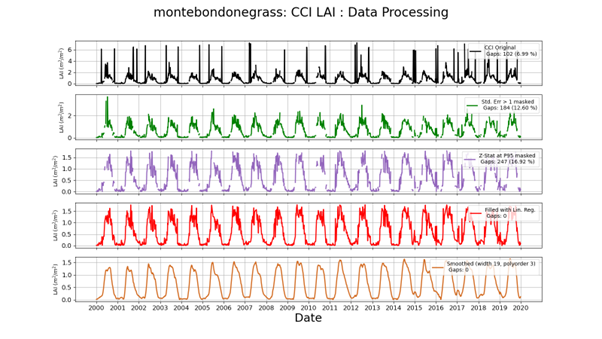
The process of understanding the characteristics and behaviour of the CCI_LAI dataset continued with efforts to smooth the data and fill gaps, enabling the calculation of phenology metrics. By adapting techniques from other LAI processing chains, the CCI_LAI dataset is transformed into a continuous time series suitable for phenological analysis. Figure 2 illustrates this process showing how the original CCI_LAI data at a single point is filtered, gap-filled, and smoothed to produce a suitable time series for this analysis. There are four stages to this process:
- Filter LAI values that have a standard error greater than one.
- Calculate z-scores for all points left in the time series and filter those with a z-score greater than the 95th percentile.
- Use linear regression to fill gaps in the remaining data.
- Use a Savitzky-Golay filter to return a smoothed time series on the same time steps as the original CCI_LAI data.
The Four Growing Season Types (4GST) methodology (Peano et al., 2019) identifies phenophases (key stages in the annual vegetation cycle) using LAI data. In this study, the same approach is applied to determine vegetation onset, which marks the start of the growing season and is indicated by an increase in leaf area, and therefore LAI. This rise in plant greenness can also be observed through in-situ imagery. One such measure of greenness is the Green Chromatic Coordinate (GCC), which is calculated from PhenoCam images (https://phenocam.nau.edu/webcam/).
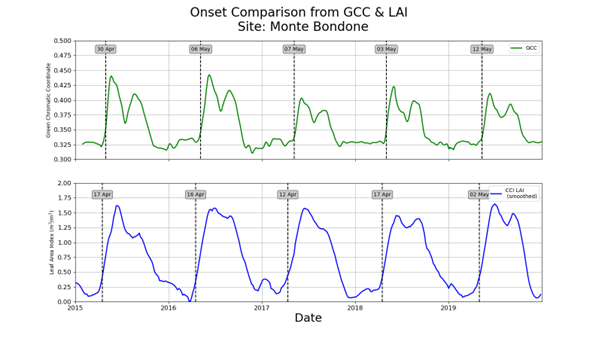
Figure 3 compares onset dates derived from satellite-based LAI data with those calculated using GCC. The method performs well across both data sources. Onset dates from GCC typically lag those from LAI by about two weeks in this case, equivalent to just 2-3 timesteps in the 5-day resolution CCI_LAI dataset. This may be due to differences in the spatial scales for which LAI and GCC are calculated; LAI data represents a much larger area, while GCC is calculated for a small region within the camera’s field of view.
The onset dates derived from the LAI data are compared to metrics calculated from LST and soil moisture. These variables help to characterise whether vegetation growth in a region is primarily driven by temperature or moisture availability. Both LST and soil moisture data are sourced from their respective ESA CCI projects.
In regions where the vegetation phenology is temperature driven, LST can be used to calculate Growing Degree Days (GDD). GDD is a measure of accumulated heat used to predict plant development stages. GDD thresholds can then be compared with vegetation onset dates derived from LAI data. A case study was conducted at the Monte Bondone PhenoCam site in Northern Italy to explore this relationship. GDD values were calculated using CCI LST data from microwave sensors, which provide multiple all-sky observations per day. The method of Baker (1980) was applied to compute the GDD values.
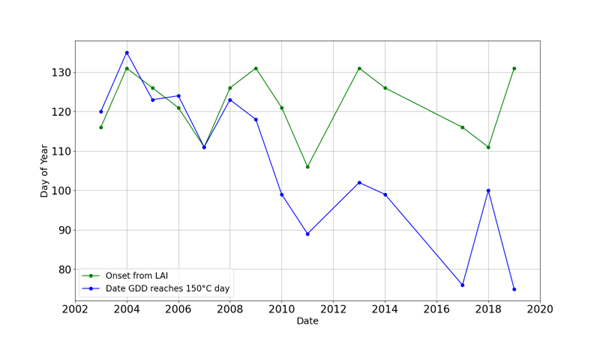
Figure 4 shows the date each year when the GDD at Monte Bondone exceeds 150 oCday (blue), alongside the vegetation onset date derived from the CCI_LAI data (green). During the early part of the study period (2003-2009), both events occur around the same day of the year, indicating close alignment between temperature accumulation and vegetation onset. However, in the latter years of the study, a divergence emerges. The GDD thresholds are reached earlier compared to the LAI derived onset date. The shift suggests that increasing LST, likely driven by climate change, is advancing the thermal conditions suitable for growth at this site. Further research is needed to understand why the vegetation onset date, as detected by LAI, does not consistently follow this trend.
In regions where the vegetation phenology is driven by moisture availability, soil moisture observations can be used to calculate the Standardized Amount of volumetric Soil Moisture (SASM), as described by Harris et al. (2025). The SASM framework explicitly accounts for both long-term and short-term variability in soil moisture, capturing the key timescales of moisture accumulation. To explore this in a moisture-driven context, a case study was conducted at a savannah site in Chad (14.5°N, 22°E). Like Monte Bondone, this site is classified as natural grassland, but it experiences a markedly different climate, characterised by high temperatures, low precipitation, and strong seasonal variability.
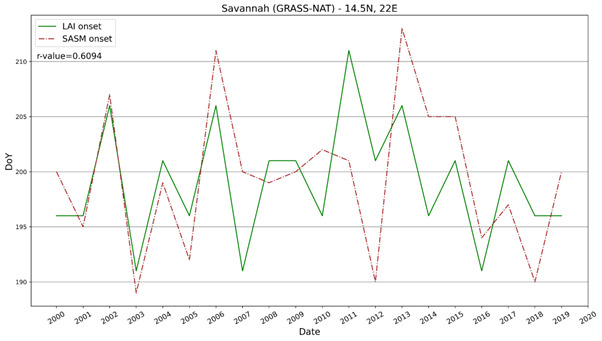
Figure 5 shows the day of the year when phenological onset is predicted at the savannah site in Chad, using the 4GST method based on LAI (green line) and the SASM algorithm based on soil moisture (brown line). Across the 2000-2019 period, the soil moisture-based SASM captures the overall trend in LAI-derived onset dates well, with a Pearson correlation of 0.6. In particular, the SASM method predicts the onset date within five days of the LAI-based date in 11 out of the 20 years analysed. The maximum difference between the two methods across the study period is ten days, equivalent to two timesteps in the 5-day resolution LAI dataset. Most of the discrepancies between the two approaches likely stem from differences in the temporal resolution of the CCI_LAI and soil moisture datasets, highlighting an opportunity to improve onset detection as higher-resolution data become available.These results are based on a series of site-specific case studies. In future work, the relationships identified in this study will be extended to broader spatial scales such as biomes and climate zones. This will enable comparisons with Earth System Models (ESMs) from CMIP6 to support the objectives of the CMUG OWP5.2 study. Additionally, the OWP5.9 study will focus on analysing the relationship between vegetation and hydrometeorological variables using both satellite observations and model outputs.
References
Baker, C. R. B. (1980). Some Problems in Using Meteorological Data to Forecast the Timing of Insect Life Cycles. EPPO Bulletin, 10(2). https://doi.org/10.1111/j.1365-2338.1980.tb02628.xHarris, B. L., Taylor, C. M., Dorigo, W., Zotta, R. M., Ghent, D., & Noguera, I. (2025). Global observations of land-atmosphere interactions during flash drought. EGUsphere, 2025, 1-24. https://doi.org/10.5194/egusphere-2025-1489Peano, D., Materia, S., Collalti, A., Alessandri, A., Anav, A., Bombelli, A., & Gualdi, S. (2019). Global variability of simulated and observed vegetation growing season. Journal of Geophysical Research: Biogeosciences, 124, 3569–3587. https://doi.org/10.1029/2018JG004881