
ESA CCI data within the Copernicus Climate Data Store Toolbox
Key Results
- Inclusion of CCI ECV datasets within the Climate Monitoring Facility in the C3S Toolbox.
- The Climate Monitoring Facility (CMF) is an interactive web-based application developed as part of the Toolbox of the Copernicus Climate Change Service (C3S). It allows users to display Climate Data Records (CDRs) including the Essential Climate Variable (ECV) datasets produced by the CCI ECV projects. Various statistics can be displayed based on pre-calculated regional averages of mean monthly data and different datasets can be compared.
- Recent improvements to the CMF have seen the inclusion of Soil Moisture and Sea Surface Temperature CCI datasets.
What is the Climate Monitoring Facility?
CMF is an interactive interface that facilitates the evaluation of the multi-year variability of various statistics computed from a variety of climate data records (CDRs). The tool is designed to evaluate the long-term homogeneity and perform a consistency analysis of the selected CDRs. All data included in the C3S Climate Data Store can be accessed by the CMF and these include the following ESA CCI ECVs:
- Sea Surface Temperature: https://cds.climate.copernicus.eu/cdsapp#!/dataset/satellite-sea-surface-temperature?tab=overview
- Ocean colour: https://cds.climate.copernicus.eu/cdsapp#!/dataset/satellite-ocean-colour?tab=form
- Sea level: https://cds.climate.copernicus.eu/cdsapp#!/dataset/satellite-sea-level-global?tab=overview
- Sea ice: https://cds.climate.copernicus.eu/cdsapp#!/dataset/satellite-sea-ice?tab=form
- Soil moisture https://cds.climate.copernicus.eu/cdsapp#!/dataset/satellite-soil-moisture?tab=overview
- Ozone: https://cds.climate.copernicus.eu/cdsapp#!/dataset/satellite-ozone?tab=overview
- Aerosols: https://cds.climate.copernicus.eu/cdsapp#!/dataset/satellite-aerosol-properties?tab=form
How does it work?
The comparisons are based on pre-calculated regional averages of monthly mean data. Geographical regions include those used in the C3S monthly climate bulletins, NUTS regions (country sub-divisions used for statistical analysis) and those defined in the UN Intergovernmental Panel on Climate Change 6th Assessment Report (IPCC AR6).
Caution should be used when assessing the results, as differences may occur in the data coverage of different data streams used to produce those averages. This is particularly the case of the comparisons between observations and modelled variables from reanalyses.
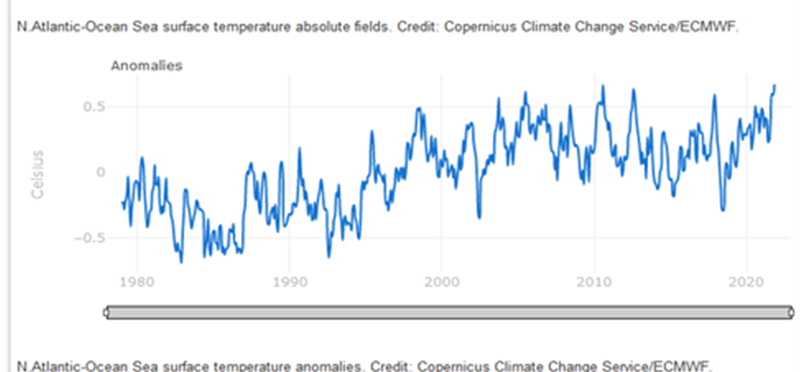
Example output
The timeseries below displays sea-surface temperature anomalies over the period 1980-present day calculated from the CCI SST ECV dataset.
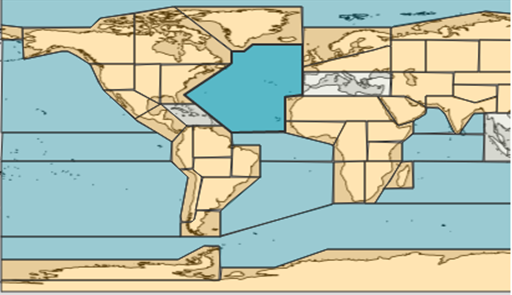
The map below shows the North Atlantic region (highlighted in darker blue) over which the anomalies above are calculated. This and the other regions marked are those used for regional analysis of observed and projected climate change in the IPCC WG I contribution to the AR6[1] as defined by Iturbide et al. (2020).
[1] https://www.ipcc.ch/assessment-report/ar6/
References
M. Iturbide, J.M. Gutiérrez, L. Alves, J. Bedia, R. Cerezo-Mota, A. Di Luca, S.H. Faria, I. Gorodetskaya, M. Hauser, K.J. Hennessy, R. Jones, S. Krakovska, R. Manzanas, D. Martínez-Castro, G.T. Narisma, I. Pinto, S.I. Seneviratne, B. van den Hurk, C.S. Vera, 2020: An update of IPCC physical climate reference regions for subcontinental analysis of climate model data: Definition and aggregated datasets. Earth Syst. Sci. Data, 12, 2959–2970, 2020 https://doi.org/10.5194/essd-12-2959-2020
About the author

This article was produced in 2022 by Iryna Rozum. Iryna is a Climate Data Store analyst at ECMWF, and currently focuses on facilitating the processing and management of large climate data volumes, and developing visualisations to study regional and global impact of climate change.