
Ozone retrieval assimilation: nadir-BUV or IR limb-emission?
Forget the typical Numerical Weather Prediction assimilation paradigm: the more the better! If one had to decide between assimilating ozone products retrieved from a typical nadir-BUV (Backscatter UltraViolet) instrument or from an Infrared (IR) limb emission, what would the best choice be? Here the best choice is intended as the dataset that produces the largest or most wide-spread positive impact on the resulting ozone analyses.
Both nadir-BUV and IR limb emission datasets have advantages and disadvantages:
- Nadir datasets benefit from a better horizontal resolution than limb ones, but the latter provide a better vertical resolution than the former.
- Nadir-BUV instruments have sensitivity to most levels in the atmosphere with the highest sensitivity to the middle stratosphere, where ozone mixing ratio peaks, but can only provide measurements in daytime.
- Limb instruments cannot provide measurements in most of the troposphere while being sensitive to the region from the upper troposphere up to generally the lower mesosphere, and — when designed to make measurements in a spectral range like the IR — they can also make measurements in night-time conditions, thus overcoming one of the most severe limitation of UV-Visible measurements.
These considerations would call for long-term and consolidated plans on Earth Observations (EO) able to provide continuous limb data availability to monitor changes in the ozone amounts, especially in the stratosphere, assess the effectiveness of the 1997 Montreal Protocol and subsequent amendments to control the emission of Ozone-Depleting Substances, and support projection studies on future ozone recovery.
An analysis of the EO capability planned for the next decade up to about 2025 shows a generally good temporal coverage from ozone-sensitive nadir-looking instruments, many of which are or will be operated as part of operational missions — thus ensuring long term data provision (for instance the forthcoming Sentinels 4 and 5 part of the Copernicus programme, www.copernicus.eu). The same cannot be said for instruments with a limb viewing geometry that are rarely operational and their combined data record show significant gaps.
We examined this aspect using two ozone profile datasets generated by the ozone consortium of the European Space Agency Climate Change Initiative (ESA O3-CCI) from the nadir MetOp-A/GOME-21 and limb ENVISAT/MIPAS2 measurements. These two datasets were individually added to a reference set of ozone observations and assimilated in the ECMWF data assimilation system during the period July-October 2008. The two sets of resulting analyses were compared with that from a control experiment (labelled as CTRL), which is only constrained by the reference dataset, and independent, unassimilated ozone observations.
The figure below shows the level of agreement between ozone sonde profiles used as an ozone reference and co-located ozone analysis profiles obtained from the three experiments (CTRL in blue, that assimilating also GOME-2 in red, and that assimilating also MIPAS in black). Each panel refers to a different latitudinal band. The agreement is provided in terms of Root Mean Square Error (RMSE) measured in Dobson Units (DU). Thus, the lower the value is the better the level of the agreement results.
The assimilation of either instrument leads to a reduction in the RMSE compared to the CTRL, thus leading to improved ozone analyses, although the assimilation of MIPAS data has a larger (thus better) impact than that of GOME-2.
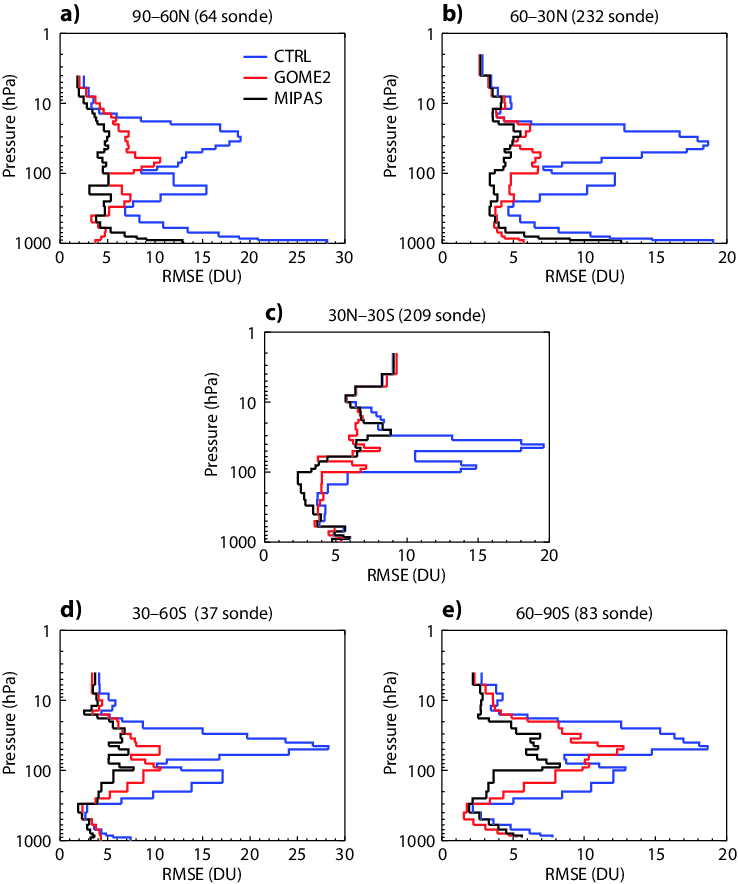
Figure 1: Fit of the ozone analyses from three experiments to ozone sondes given in terms of the RMSE over five latitudinal bands and over the period August-October 2008. The three analyses were taken from CTRL (blue lines), and two experiments assimilating also the reprocessed GOME-2 nadir ozone profiles (red lines) and MIPAS limb ozone profiles (black lines) from the O3-CCI. The latitudinal band each panel refers to and the number of ascents included in the average can be found in the corresponding panel title. Data are in Dobson Unit (DU). Courtesy of Dragani, 2016.
High vertical resolution ozone profile observations, as provided by limb instruments, are essential to accurately monitor and forecast ozone concentrations in a data assimilation system, and there is a need for long-term EO plans for limb-viewing instruments.
1 The Meteorological Operational Satellite A / Global Ozone Monitoring Experiment 2 sensor
2 The ENVIromental SATellite / Michelson Interferometer for Passive Atmospheric Sounding
Learn more
- Rossana Dragani et al., 2016: A comparative analysis of UV nadir-backscatter and infrared limb-emission ozone data assimilation. Atmospheric Chemistry and Physics, 16, 8539-8557, doi:10.5194/acp-16-8539-2016
About the author

This article was produced in 2016 by Rossana Dragani at ECMWF. Rossana's research interests lie in the field of data assimilation with a focus on the exploitation of atmospheric composition data from satellite measurements.