
Use of ocean CCI data in Met Office model
CCI observation products are vital for understanding climate variability and change, and for monitoring the climate system. However, coverage is incomplete, not all variables of interest are routinely observed, and there is no predictive capability.
Models are required to address these aspects. In conjunction with observations they can provide a much fuller understanding of the Earth system.
A powerful way to combine these sources of information is through data assimilation, which can be used to create reanalyses – spatially complete reconstructions of past conditions. As with satellite climate data records (CDRs), reanalyses are of most benefit to climate studies if they are stable and consistent, both throughout time and between model variables.
Ocean-ice-biogeochemistry model
In CMUG, the 1/4° resolution NEMO-CICE-HadOCC ocean-ice-biogeochemistry model has been used to explore the impact that assimilating different combinations of ocean CCI products has on reanalyses, and their resulting consistency.
An important way in which CDRs and reanalyses should be consistent is in the representation of spatial features. In the ocean, examples include the positioning of fronts and eddies, and details of major currents such as the Gulf Stream and Agulhas Current. One way to assess this is by analysing the horizontal gradients of different fields.
Gradients of sea surface temperature (SST), sea level anomaly (SLA) and surface log10(chlorophyll) were calculated by binning model and observation values at observation points onto a regular grid over a month and calculating their derivative.
Spatial consistency in ocean CCI data
Gradients have been plotted for December 2010 in the Agulhas Current region for the CCI products, a model free run and a model run assimilating CCI SST, SLA, chlorophyll and sea ice concentration products (see figure).
SST and surface log10(chlorophyll) were binned onto a 1/4° grid, as this gave clearest resolution of features for these variables, while SLA was binned onto a 1/2° grid, due to the lower observational coverage.
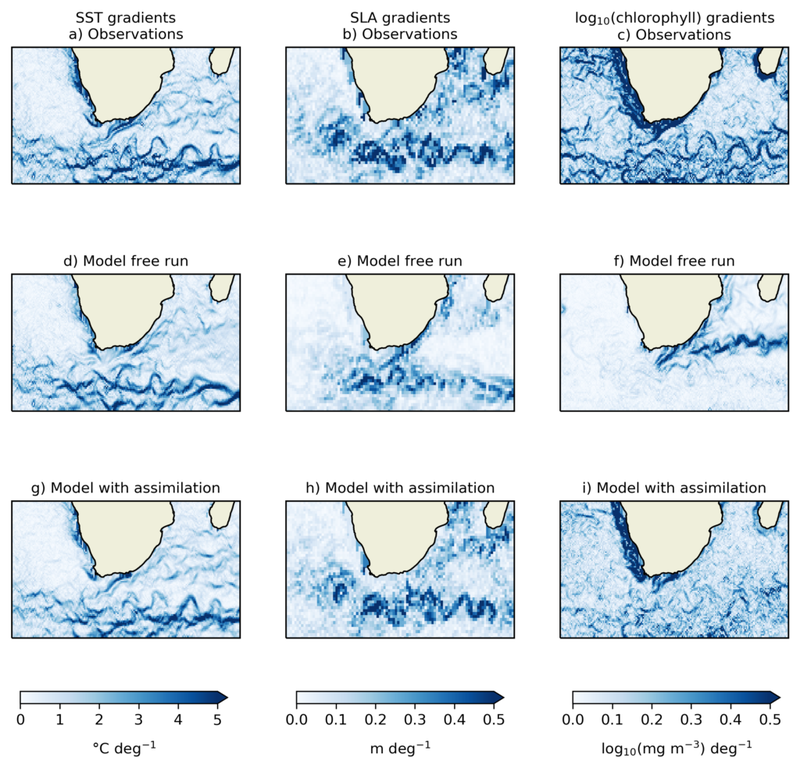
Caption: Observed and modelled gradients in the Agulhas Current region for December 2010. Gradients are shown for SST (a, d, g), SLA (b, e, h) and log10(chlorophyll) (c, f, i), from the CCI observation products (a, b, c), a model run with no data assimilation (d, e, f) and a model run assimilating CCI SST, SLA, chlorophyll and sea ice concentration products (g, h, i).
In the observation fields (Figure 1 a-c)
A good correspondence can be seen between features in each variable. While the position of gradients is not expected to be identical in all fields, SST fronts can generally be found around the eddies identified in the SLA fields, with the log10(chlorophyll) gradients showing phytoplankton blooms along these fronts, due to nutrient upwelling. This suggests that the CCI products are giving a suitably complementary view of such features.
In the model free run (Figure 1 d-f)
SST and SLA gradients are found in similar locations to the observations, but not quite as sharp, and the ocean is less energetic, as expected from the model resolution.
High primary production – the creation of new biomass through photosynthesis – associated with the Agulhas retroflection is captured well, but otherwise the log10(chlorophyll) gradients are a poor match for the observed fields.
Gradients associated with SST fronts are too weak, and Southern Ocean primary production is overly homogeneous, leading to a spuriously strong log10(chlorophyll) gradient at the boundary of the Indian Ocean and Southern Ocean.
When the CCI observations are assimilated (Figure 1 g-i)
Improvements are seen in the positions of gradients for all variables. The ocean becomes more energetic, reflected in the SLA field, and log10(chlorophyll) gradients are greatly improved, although still weaker than in the observations.
The gradients are consistent both between fields and with the observation products, giving a reanalysis which successfully incorporates the properties of the observations.
About the author

This article was produced in May 2019 by David Ford. David has worked on ocean modelling and data assimilation research at the Met Office since 2008. His main focus is on developing and validating the pre-operational global coupled physical-biogeochemical ocean modelling system. His work covers time scales from near-real-time forecasts to decadal reanalyses, with both operational and climate research applications. David has also worked on shelf seas biogeochemical modelling and validation, and developing error covariances for the data assimilation component of the Met Office’s operational physical ocean forecasting system.