
Using CCI SST and clouds for studying ENSO
The El Niño Southern Oscillation (ENSO) is the most important coupled ocean-atmosphere phenomenon affecting global climate variability on seasonal to inter-annual time scales. It is an irregularly periodical variation in winds and sea surface temperatures (SST) over the tropical eastern Pacific Ocean, affecting much of the tropics and subtropics:
- The warm (El Niño) phase is associated with large positive SST anomalies in eastern to central Pacific occurring on 3-7 years times-scales.
- The cold phase (La Niña) occurring every 2-4 years is less intense but longer lasting.
Climate models capture the basic ENSO features but the amplitude, life cycle and frequency are not properly reproduced and most models variability extends too far into the Western Pacific. To understand model performances and biases, evaluating models with observational constraints derived from multiple variables, can give new perspectives.
The phases can be classified by calculating SST anomalies for different regions of the Equatorial Pacific, most typically the Niño3.4 region as marked in Figure 1. The figure shows the correlation between CCI SST Niño3.4 index and CCI global cloud cover (CLT). The warm El Niño phases are accompanied with deep convective clouds in the central or eastern Pacific and reduced cloudiness in the western Pacific. The maximum positive correlation is for the mid Pacific shifted west of the Niño3.4 box.
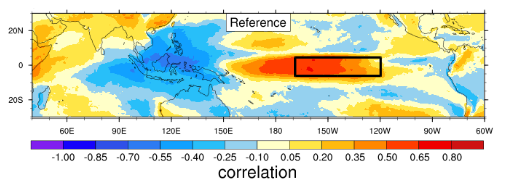
Figure 1: Correlation between CCI SST Niño3.4 SST time series and CCI global Cloud cover for 1992-2008. The black box show the Niño3.4 region (170W-120W, 5S-5N).
The scatterplot in Figure 2 show the relation between Niño3.4 indices calculated from the CCI SST and CLT monthly anomaly timeseries. Since for the time being CCI SST is only available from 1992 we also plot HadISST which is available for the whole CCI CLT timesperiod of 1982-2014. Mean CCI values for the Niño3.4 region are 38% for cloud cover and 27ºC for CCI SST and HadISST. The relationship is stronger for El Niño with high positive anomalies for SST and cloud fraction, than for La Niña, periods with negative SST and CLT anomalies. Other regions and variables are being investigated that better capture the La Niña phase.
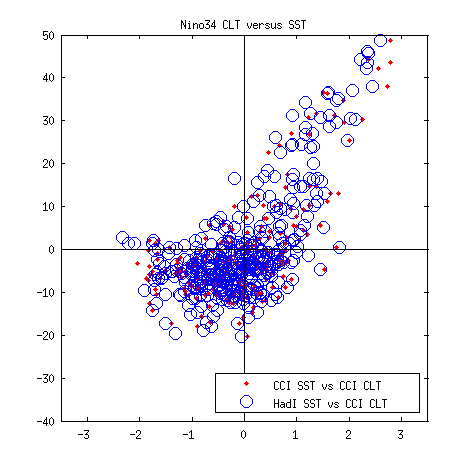
Figure 2: Scatterplot of Niño3.4 timeseries indices for CCI CLT versus CCI SST for 1992-2015 red dots and for CCI CLT versus HadISST for 1982-2014 blue circles.
About the author

Ulrika Willén is senior researcher at SMHI. One of her focus areas is to assess and use observational data for process understanding and evaluation of climate models.