
Description
This study is led by Lisa Bock from DLR. An additional contributor to this Study is Axel Lauer from DLR.
The main CCI ECVs used in this Study are Cloud, Sea Surface Temperature and Water Vapour.
The Study comprises three parts. The first part focuses on enhancing observational products for climate model evaluation with machine learning. This involves developing and applying a Machine Learning (ML)-based approach to derive cloud classes from high-resolution satellite data and coarse-resolution climate models; the application of ML to ESA CCI Cloud data leading to timeseries of labelled ESA CCI Cloud data; and the use of this dataset for an evaluation of clouds by cloud class in climate models (here: ICON-A). The second part of the Study focuses on causal model evaluation for cloud regimes and land cover types by calculating causal networks from the timeseries of several cloud variables of ESA CCI data in order to analyse and investigate the causal connections among the cloud properties and their controlling factors. The same method is then applied to output from a global climate model (here: ICON-A) and resulting causal networks are then compared to the ones obtained from the observations in order to evaluate the models. The third part consists of an evaluation of CMIP6 models with the ESMValTool. A focus is data from the CCI Snow and Permafrost datasets being implemented into ESMValTool and whenever possible, the CCI uncertainty estimates will be used to assess whether differences in the model simulations compared with the observations are significant.
Results and conclusions
WP 5.1.1 Enhancing observational products for climate model evaluation with machine learning
A two-stage approach based on machine learning has been developed to derive cloud classes from high-resolution satellite data and coarse-resolution climate models. This approach is documented in Kaps et al. (2023) in detail. Using cloud type labels from CloudSat and collocated physical cloud properties from MODIS similar to Zantedeschi et al. (2019), cloud type labels can be generated by a deep neural network for cloudy MODIS pixels. These data are coarse-grained to the horizontal resolution of a typical climate model of 100 km x 100 km and used to train a random forest (RF) regression model to be able to derive cloud class distributions from coarse-resolution data.
The two-stage ML-approach is applied to 35 years of ESA Cloud_cci L3U-AVHRR-PM version 3.0 data (Stengel et al., 2020). The dataset contains twice daily measurements from the Advanced Very High Resolution Radiometer (AVHRR) on a 0.05°-grid (L3U data). These are used to generate the new “Cloud Class Climatology” dataset (CCClim), which is schematically shown in Figure 1.
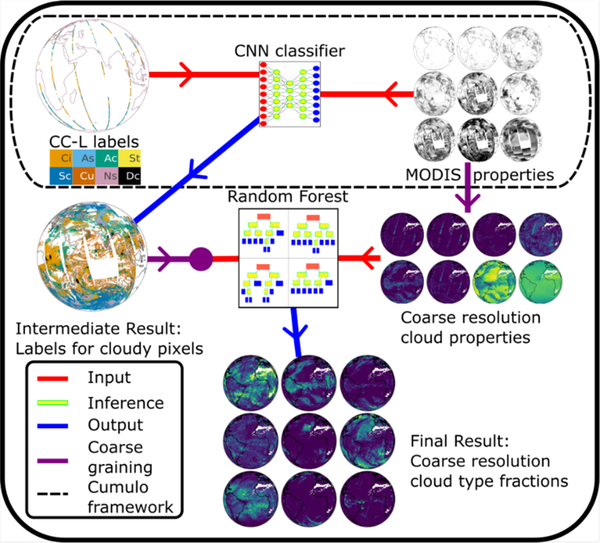
CCClim contains daily averages of nine cloud-related variables and the relative occurrences of nine cloud classes (eight cloud types + undetermined). CCClim has a global coverage over the time period 1982 through 2016 at a horizontal resolution of 1° x 1° allowing for process-oriented analyses of clouds on a climatological time scale. For details on CCClim, for more examples of potential scientific applications and for a proof of concept comparison with a simulation from the climate model ICON-A we refer to Kaps et al. (2024).
WP 5.1.2 Causal model evaluation for cloud regimes and land cover types
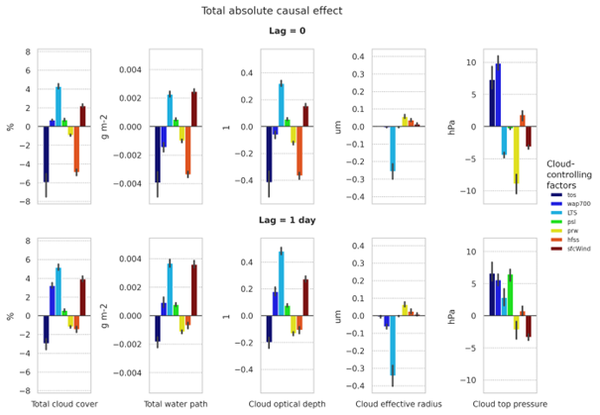
To gain a deeper understanding of the underlying mechanisms determining observed properties of marine stratocumulus clouds, we apply causal inference techniques to discover causal relationships and subsequently quantify their effects. Specifically, causal inference is used to investigate the links between cloud properties and cloud controlling factors, i.e., quantities that impact cloud formation and the temporal evolution of a cloud. For this, causal graphs are estimated from time series of satellite and reanalysis datasets averaged over the region of marine stratocumulus clouds off the coast of South America. These are then used to quantify the strength of the individual links in the resulting causal graph by applying causal effect estimation.
In this Study we use 5 years (2003-2007) of daily data from ESA CCI Cloud (Stengel et al., 2020), ESA CCI Sea Surface Temperature (Good and Embury, 2024) and ESA CCI Water Vapour (Schröder et al., 2023). Additional variables not available from satellite products are taken from the ERA5 reanalysis (C3S, 2017).
In contrast to previous studies, we are not only able to identify the most relevant cloud controlling factors, but to also quantify their causal effects on observed cloud properties. The results show that sea surface temperature, lower tropospheric stability, sensible heat flux at the surface, and surface wind speed are the primary factors influencing the cloud properties (see Figure 2). While the causal links between these factors and the three cloud properties total cloud cover, total cloud water path, and cloud optical depth show similar patterns, the cloud effective radius remains largely unexplained, suggesting that the background aerosol might also play an important role. In contrast, cloud top pressure is influenced by all cloud-controlling factors investigated except for the sensible heat flux at the surface. Quantification of the complex relationships between marine stratocumulus cloud properties and relevant cloud-controlling factors is a first step to better understand how these clouds react climate change. Furthermore, it is now possible to investigate to which degree cloud-climate feedbacks of marine stratocumulus clouds simulated by global climate models are realistic.
More details on the method and the results can be found in Bock et al. (submitted).
OWP5.1.4 Evaluation of CMIP6 models with the ESMValTool
Results and conclusions will be provided once this part of the Study is complete.
References
Bock, L., Lauer, A. and Runge, J. (2025): Quantifying the causal effect of cloud controlling factors on marine stratocumulus clouds, submitted to Atmos. Chem. Phys.
Copernicus Climate Change Service (C3S) (2017). ERA5: Fifth generation of ECMWF atmospheric reanalyses of the global climate, edited, Copernicus Climate Change Service Climate Data Store (CDS). https://cds.climate.copernicus.eu/cdsapp#!/home.
Good, S. A. and Embury, O. (2024): ESA Sea Surface Temperature Climate Change Initiative (SST_cci): Level 4 Analysis product, version 3.0, https://doi.org/10.5285/4A9654136A7148E39B7FEB56F8BB02D2.
Kaps, A., Lauer, A., Camps-Valls, G., Gentine, P., Gómez-Chova, L., & Eyring, V. (2023). Machine Learned Cloud Classes From Satellite Data for Process-Oriented Climate Model Evaluation. IEEE Transactions on Geoscience and Remote Sensing, 61, 4100515, https://doi.org/10.1109/TGRS.2023.3237008.
Kaps, A., Lauer, A., Kazeroni, R., Stengel, M., and Eyring, V. (2024): Characterizing clouds with the CCClim dataset, a machine learning cloud class climatology, Earth Syst. Sci. Data, 16, 3001-3016, https://doi.org/10.5194/essd-16-3001-2024.
Schröder, M., Danne, O., Falk, U., Niedorf, A., Preusker, R., Trent, T., Brockmann, C., Fischer, J., Hegglin, M., Hollmann, R., and Pinnock, S. (2023): A combined high resolution global TCWV product from microwave and near infrared imagers - COMBI, https://doi.org/10.5676/EUM_SAF_CM/COMBI/V001.
Stengel, M. et al. (2020): Cloud_cci Advanced Very High Resolution Radiometer post meridiem (AVHRR-PM) dataset version 3: 35-year climatology of global cloud and radiation properties, Earth Syst Sci Data Earth Syst Sci Data, 12, 41–60.