
Using ESA satellite data records researchers working on the CCI’s Sea-level budget Closure project show the sum of sea-level contributions assessed on a month-to-month basis matches the total sea-level change observed by satellites. Sea level is an important indicator of climate change, reflecting changes in several components of the climate system.
Present-day global mean sea-level rise primarily reflects thermal expansion of sea waters and increasing ocean mass due to land ice melt - two processes attributed to anthropogenic global warming - with changes in land water storage such as lakes providing an additional contribution. Global mean sea-level has risen by more than 3 cm per decade since precise satellite measurements began in the 1990s. The rate is accelerating and could reach 60-110 cm by 2100 in model projections that assume countries take little action to cut greenhouse gas emissions. This would make flooding an annual occurrence, increasing the risks faced by 1.9 billion people living in low-lying coastal regions. Better understanding of the processes that influence sea level rise will lead to better prediction of future change and decision-making.
Contributors to sea level rise
To do this, the researchers assessed how the different contributions compare with the overall change in sea level – in other words, they assessed the sea-level budget.
Changes in the mass of the global ocean was evaluated by determining the individual contributions from the Greenland and Antarctic ice sheets, the glaciers worldwide and changes in land water storage. The mass change was measured directly by satellites, such as GRACE, that observe tiny changes of Earth’s gravitational pull entailed by changes of ice or water masses.
Satellite data records from ESA’s Climate Change Initiative for both the Greenland and Antarctica ice sheets as well as 205,000 glaciers world-wide, were used to quantify changes in land ice mass. The mass change was measured directly by the GRACE satellite, that can observe tiny changes of Earth’s gravitational pull entailed by changes of ice or water masses as a direct comparison. Sea surface temperature satellite record (in combination with observations from a network of sea-borne ARGO buoys) were used to calculate the contribution of thermal expansion to sea-level rise. Once assessed these data were compared with the CCI’s sea level altimetry record.
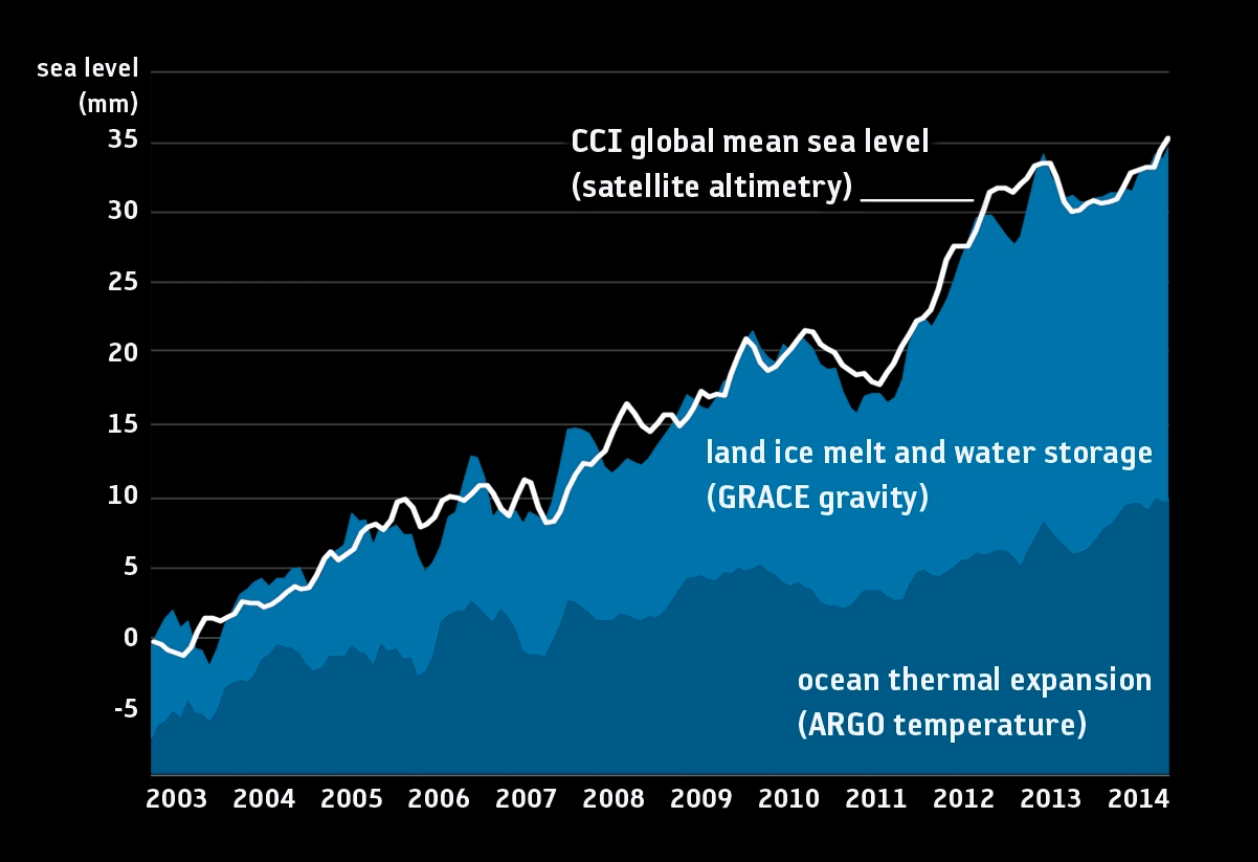
The graph above shows how the observed change in global mean sea level using satellite altimetry (white line) match closely to the combined contribution of meltwaters from land ice change and water storage (light blue area) and ocean thermal expansion.
Land ice and expansion?
Over the period 1993-2016 they estimate that 38% of sea-level rise was derived from thermal expansion while a 57% contribution was derived from changes in ocean mass, with glacial meltwaters providing the largest proportion (21%) followed by ice sheets (Greenland – 20% and Antarctica 6%), with 10% coming from land water storage.
The results published in Earth System Science Data also contributed to the IPCC Sixth Assessment report. These findings are in line with previous studies, but they gain additional confidence through the advancements of the data analysis involved. These advancements include the consistent approach to specifying the accuracy limits throughout all elements of the sea-level budget.