
With global temperatures having already risen by 1.1°C relative to pre-industrial levels, it is critical that policymakers have an accurate picture of emissions at both national and global scale.
New methods based on ‘atmospheric inversion’ modelling combined with independent satellite measurements improve the situation. The approach, pioneered by researchers working within ESA’s Climate Change Initiative now make it possible to determine emissions for large countries, or groups of countries, and evaluate national greenhouse gas inventories used to report progress towards holding global temperature in line with the Paris Agreement.
In a collective bid to combat global warming, many countries have committed to balancing greenhouse gas emissions with removals from natural processes and human activities, with some providing ambitious near-term reduction targets. At the country level, progress towards these targets is reported through periodic national greenhouse gas inventories. These ‘national accounts’ are submitted to the United Nations Framework Convention on Climate Change (UNFCCC) to assess collective action as part of a five-yearly global stocktake cycle.
The guidelines used to generate inventories however have their limitations. For example, they are based on scaled-up, sector-specific activity and rigid emission factors. Major emissions sources, such as those from unmanaged land, fall out of scope. And, importantly, countries are only encouraged, but not required, to verify inventories against independently observed measurements.
Space-based Earth observation – a whole of atmosphere view
To improve the situation, researchers working as part of the Regional Carbon Assessment and Processes (RECCAP-2) project, part of ESA’s Climate Change Initiative combined satellite measurements of atmospheric carbon dioxide and methane, and in-situ measurements of nitrous oxide, with a model to calculate the movement, or ‘flux’, of these greenhouse gases between the land surface and atmosphere.
This ‘inversion method’ makes it possible to determine emissions for a selection of high-emitting countries (or groups of countries) by comparing inventories against independent measurement – something that is recommended by the IPCC GHG reporting guidelines.
According to Philippe Ciais, from the Université Paris-Saclay and RECCAP-2 science leader explains, “if regularly applied, [the new methods] will not only improve transparency in the accounting process but will also improve the effectiveness of mitigation policy and progress by individual countries to meet their pledges as part of the Paris Climate Agreement.”
Comparing inversions and inventories
The methods are published Earth System Science Data as part of a study that analyses UNFCCC greenhouse gas inventories and compares them with corresponding inversions for selected high-emitting countries (or groups of countries). Significant discrepancies were found:
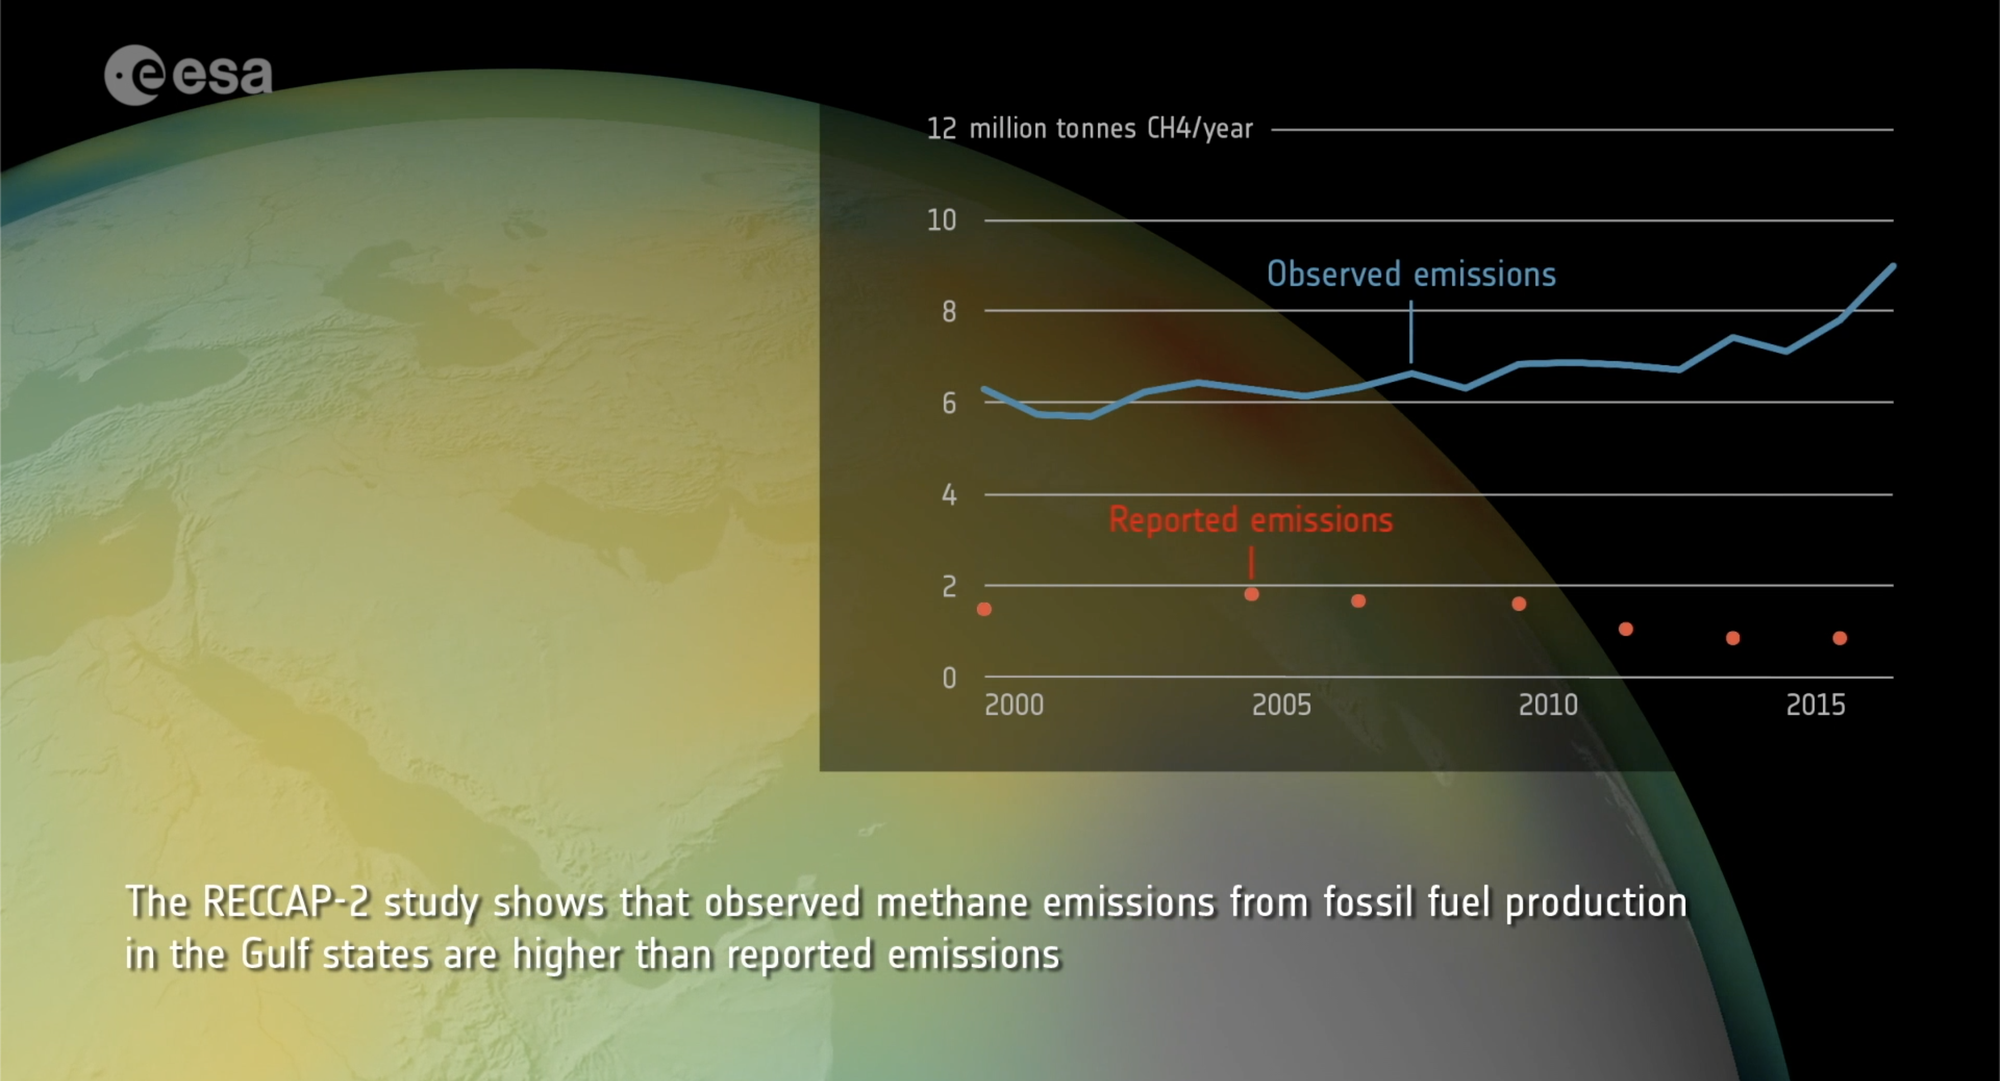
- Methane emissions compared
A fair agreement was found between inversions and inventories for anthropogenic methane sources for large emitters such as the EU, US and China. However, the study authors found emissions to be several times higher using the inversion method compared to most national reports for oil and gas extracting states in central Asia and the Persian Gulf region, compared to the official report (see figure below).
- Land carbon sink compared
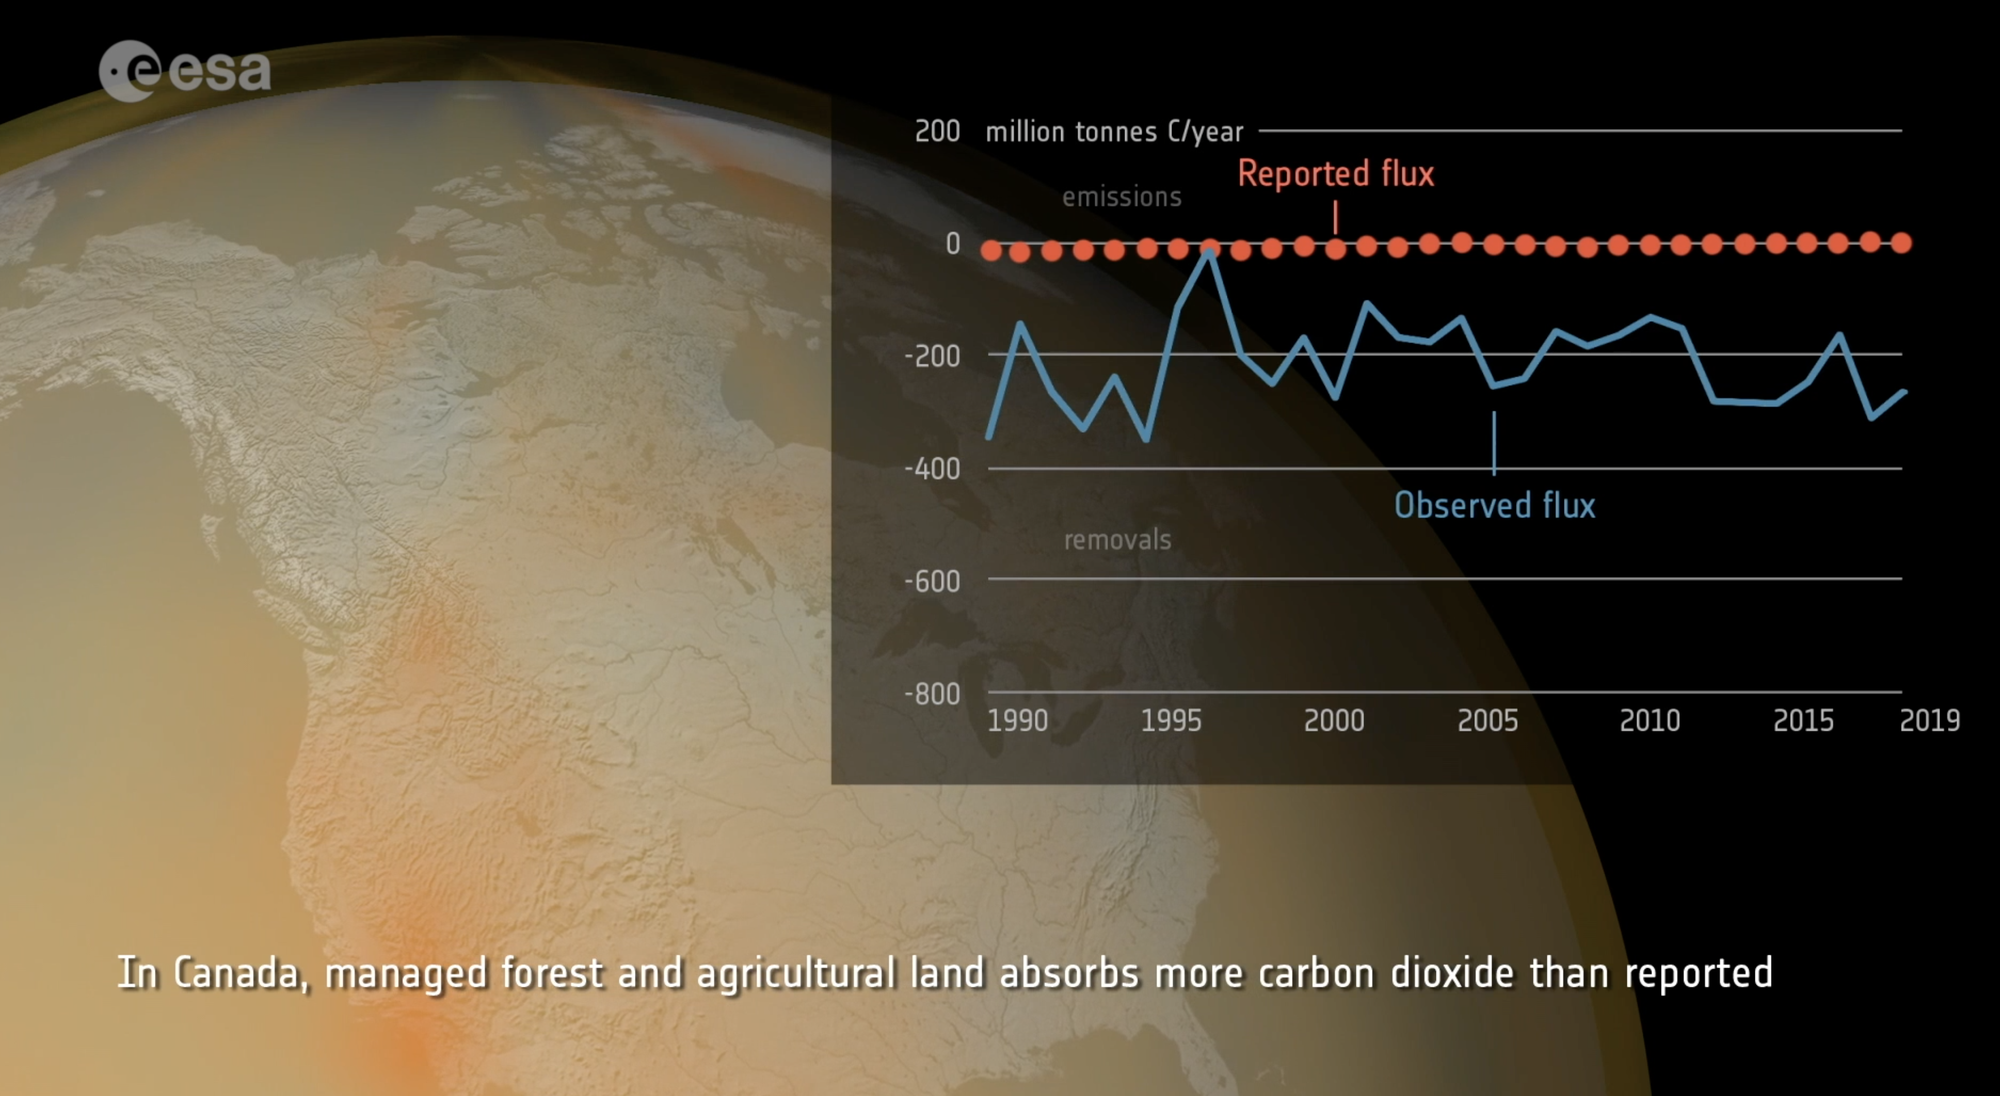
Absorbing 1.4 billion tonnes of carbon per year, the observed size of the global land carbon sink comprising ecosystems in both managed and unmanaged land, was several times larger than the 0.3 billion tonnes of carbon per year obtained by summing up countries’ reports.
The study found that inventories tended to underreport the land carbon sink, with a larger reporting disparity for temperate and northern hemisphere countries, such as Canada and across the European Union.
In part, the disparity is explained by the carbon stored by unmanaged ecosystems that fall outside the inventory reporting protocol defined by the IPPC, while the full picture is observable from space.
The figure below shows discrepancies between land carbon sink reported via the national inventory and inventory method for Canada between 1990 and 2019.
- Carbon dioxide flux – unmanaged land compared
The all of atmosphere view provided by the inversion approach provides an opportunity to improve the accounting of carbon flux between the atmosphere and managed land.
For example. the study authors recommend that the lateral movement of carbon is accounted for, something which can be quantified using inversion method but is not accounted for under current inventory guidelines. For example, the export and import across borders of harvested wood, and the anthropogenic component of rivers carrying carbon across borders should be factored into national reporting.
Unlike national reporting guidelines, the inversion method also captures seasonal and interannual extremes, such as drought and major wildfires, which are expected to increase in both frequency and severity as global temperatures ratchet upwards.
In summary
Methods developed by the RECCAP-2 project improve the consistency between national greenhouse gas inventories and atmospheric inversions. As inversions use independent measurements such as those derived from space, the evaluation of nationally reported emissions is more robust and so paves the way for enhances mitigation effectiveness.
Explore the data, paper & RECCAP-2 project
To find out more, visit the RECCAP-2 project page, access the study paper (Deng et al 2021) or view ESA's Earth observing dashboard to compare CO2, N2O and CH4 emissions as reporting via national inventories or derived using the inversion method devised by the study authors.