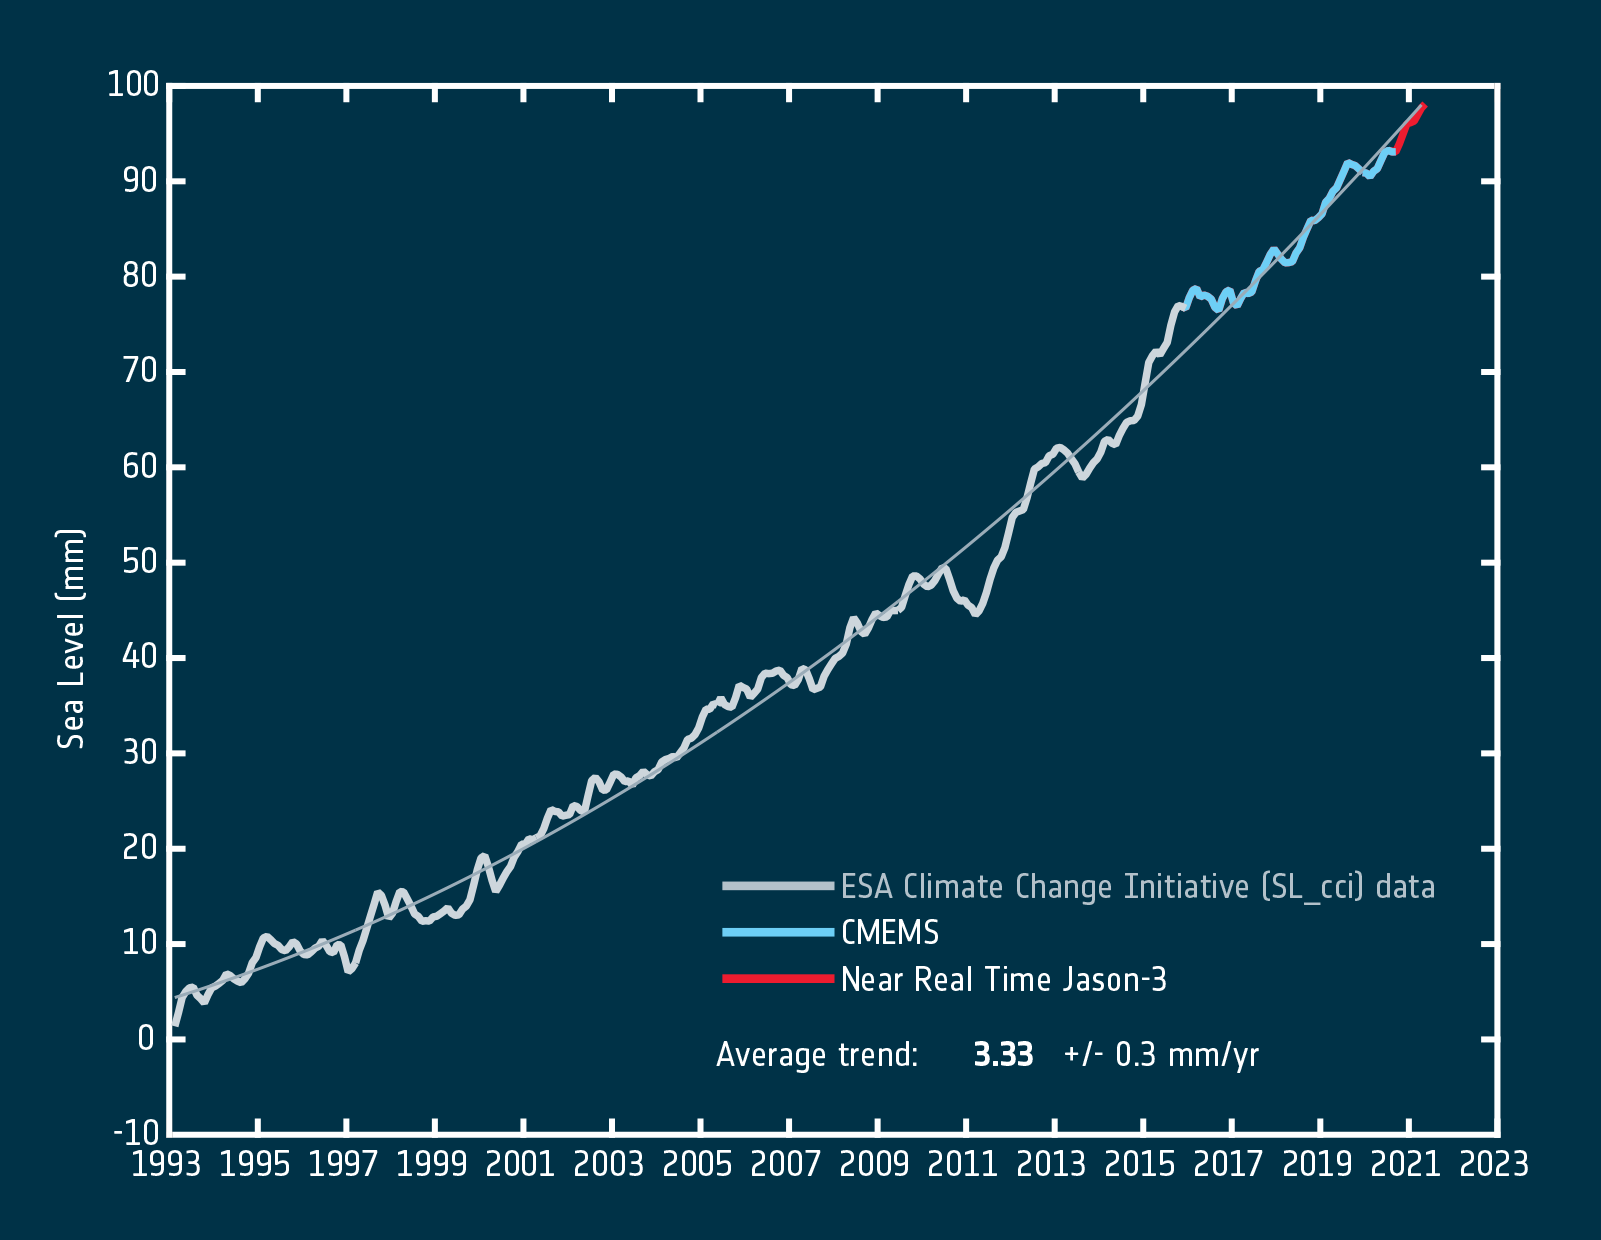
Globally, sea level has risen by around 15 cm during the 20th century and is currently rising more than twice as fast – 3.3 mm per year (between 1993-2022). The rate of increase is accelerating, nearly doubling to 4.5 mm/year from 2011 to 2020. It could reach 60-110 cm by 2100 based on model projections that assume countries take little action to cut greenhouse gas emissions.
By merging observations from 11 different satellite missions, the ESA Climate Change Initiative Sea Level project - has contributed to the generation of a highly precise and continuous 29-year record of sea-surface height. An accurate understanding of the changes in global sea level accurate understanding of rising sea levels, including important regional differences, is vital for the international community to develop an effective response.
Although thermal expansion and meltwater from land ice are the dominant contributors to rising sea level, there are many local differences. These differences can be caused by ocean currents, gravitational pull of the geoid and events such as El Niño
Regional sea level trends
Sea level does not rise uniformly everywhere - measurements only possible by satellite show how sea levels across the globe vary due to winds, atmospheric pressure, the ocean floor, Earth's rotation as well as the water's temperature and salinity.
The impacts of global mean sea-level rise are not the same everywhere. Along coastlines, sea-level rise can exceed the global mean because of complex ocean dynamics nearer land, while land subsidence caused by human activity is compounding the problem in many of the world’s coastal cities.
Understanding these regional differences is critical for assessing the risks sea level changes pose to coastal communities, and informing local adaptation planning.
In some areas, sea level rise can be five times that of the global average, while in other places it is falling. The interactive globe (right) illustrates the regional sea level trend (1993-2022) to show more clearly the differences from the global average sea level. The most extreme sea level variations are usually around strong ocean currents, such as the Gulf Stream in the North Atlantic and the Kuroshio Current in the North Pacific, where the motion of the current on the rotating Earth causes a slope in the sea surface.