
This section provides access to various datasets published by the Antarctic Ice Sheet ECV project. Samples of the project's datasets are also available on the ESA Climate Office Open Data Portal.
Surface elevation changes
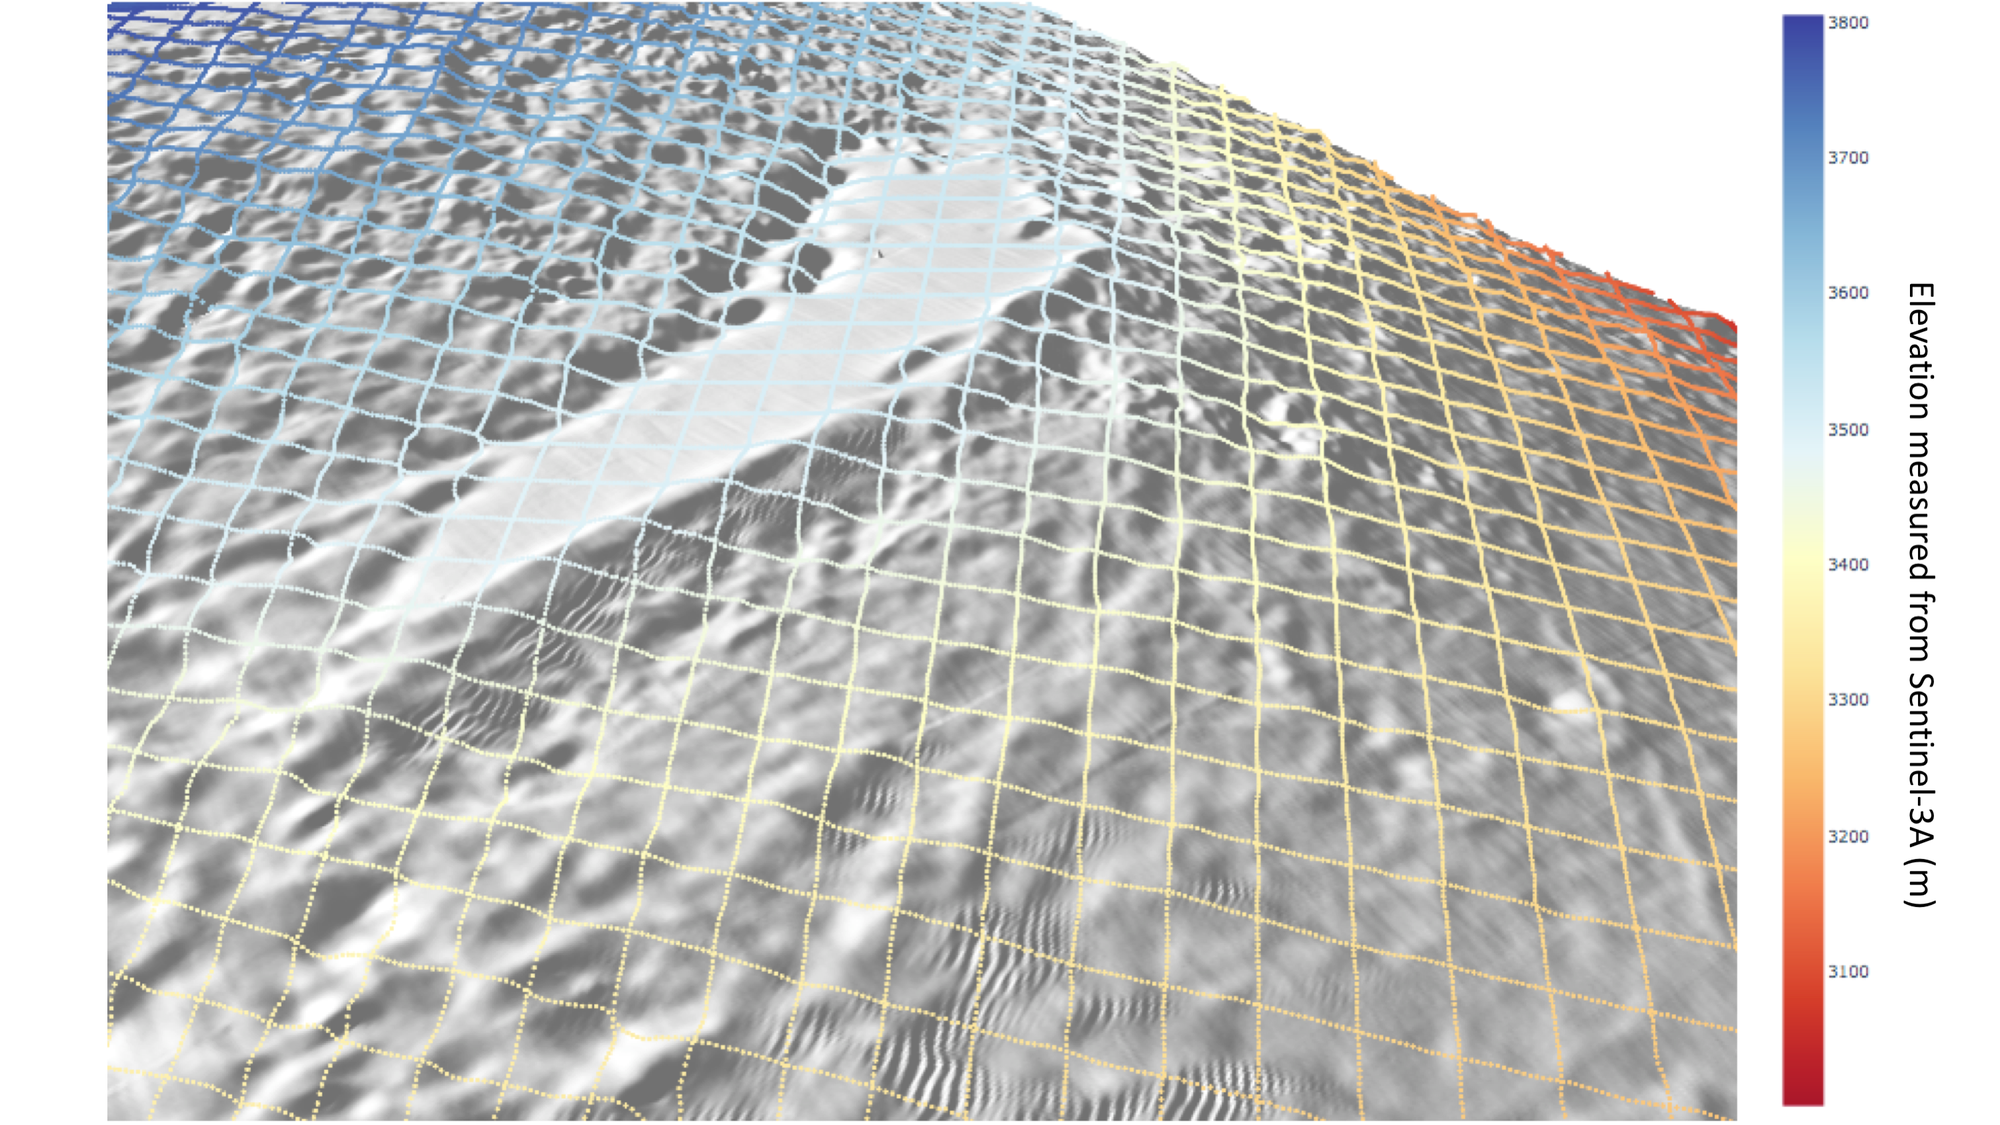
Surface elevation changes (SECs) of an ice sheet are directly linked to the atmospheric forcing and hence climate changes. The SEC reflects the vertical component of ice sheet mass balance. SEC is derived from satellite radar altimetry data, and therefore, the product is the elevation change of the reflecting surface rather than the snow surface.
Thanks to a succession of ESA satellite missions starting with ERS-1 in 1992 and continuing with CryoSat-2 and the Sentinel-3 missions, satellite altimetry provides the longest unbroken record of ice sheet mass balance from all geodetic techniques. Altimeter measurements of elevation change are extremely precise because they require only modest adjustments to account for sensor drift, changes in the satellite attitude, atmospheric attenuation, and movements of Earth's surface.
The Antarctic_Ice_Sheet_cci+ project will produce a continuous monthly time series of surface elevation change measured using over 28 years of radar altimetry satellites, including ERS-1, ERS-2, ENVISAT, CryoSat-2, Sentinel-3A and Sentinel-3B.
SEC products are hosted by CPOM: http://www.cpom.ucl.ac.uk/csopr/icesheets3
Ice Velocity

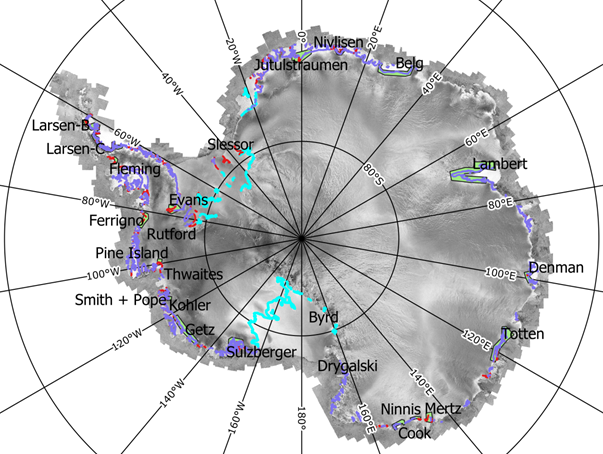
There is ample evidence indicating ongoing large and rapid changes in the Antarctic Ice Sheet, including the break-up of several ice shelves, glacier acceleration, and thinning and retreating grounding lines. The changes led to an increased ice discharge and contributed to sea level rise. Mapping ice sheet velocity (IV) and temporal changes in flow velocity provide key information for investigating the dynamic response of glaciers and ice sheets to changing boundary environmental conditions.
In the Antarctic Ice Sheet CCI project, SAR images acquired by the Sentinel-1 mission are used to derive ice flow velocity in Antarctica. Sentinel-1 has provided the opportunity to derive the ice flow velocity of key ice streams and outlet glaciers in Antarctica on a regular basis. The continuous coverage currently includes most of the Antarctic Ice Sheet margin, allowing for the retrieval of dense time series of ice flow for major Antarctic outlet glaciers previously only seldom observed.
In the current phase of the project, the system for IV retrieval will be further adapted and improved to accommodate new user requirements, increase data coverage and temporal resolution, and prepare for upcoming new SAR satellite missions (e.g. ROSE-L, NISAR).
We also plan to exploit the existing archive of ice velocity data and study the feasibility of a new ECV product on ice velocity change (IVC), detailing the spatial distribution of changes in ice flow rate over specified time intervals. IVC is a fundamental ice sheet parameter which is key to detecting and investigating dynamic instabilities and to identifying temporal fluctuations and long-term trends, thereby improving future predictions of ice flow in response to a changing climate.
IV products are provided on ENVEO CryoPortal and CEDA.
Grounding Line Location
The location of the transition where the ice resting on bedrock detaches and becomes a floating ice shelf is a critical parameter needed for calculations of the ice sheet mass budget, as well as for modelling ice-ocean interactions, ice sheet dynamics, subglacial melt and oceanic tides. Due to its importance, the grounding line position is one of the key parameters of the ice sheets, which have been derived from satellite observations within the project.
The retrieval of the grounding line position is based on the influence of the ocean tides on the floating ice, which rests in hydrostatic equilibrium. Due to the fact that this tidal rise is absent on the grounded part of the glacier, a vertical deformation appears in the transition area.
The InSAR double differencing method (DInSAR) has been identified to be one of the most accurate techniques for locating the vertical tidal deformation of the ice sheet. At least two pairs of coherent repeat pass data sets must be combined in order to remove the common velocity component, revealing the vertical component due to tidal motion. In practice, the major limiting factor of this technique is the availability of data sets with sufficiently high InSAR coherence. Physical phenomena such as snow accumulation, drift or melting may significantly change the surface properties between the satellite passes and thus the backscatter behaviour, which can lead to loss of phase coherence in the interferograms.
The Antarctic_Ice_Sheet_cci+ project will continue the generation of GLL from recent Sentinel-1 constellation acquisitions on selected key glaciers, thus extending the temporal extension of GLL datasets.
GLL products are provided on ENVEO CryoPortal: http://cryoportal.enveo.at/. Access to product downloads requires registration and login. There are different user levels (anonymous, external, partner & staff) that determine the permissions for reading and accessing the data.
Grounding Line Migration

The short-term variation of the grounding line position will complement the time stamped Grounding Line Location (GLL) products by adding information on the extent of the grounding zone (the area in which the ice shelf repeatedly rests on the ocean bed).The aim of the Grounding Line Migration (GLM) product is to provide the short-term temporal variations of the grounding line position within the grounding zone but also separate this short-term position change from a long-term climatic induced position change that causes a relocation of the grounding zone. This new product is based on time series of GLL products and is currently under development.
Gravimetric Mass Balance
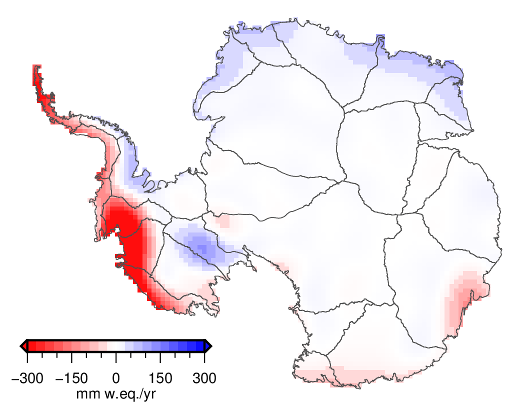
The Gravimetric Mass Balance (GMB) products are based on the GRACE (Gravity Recovery and Climate Experiment) and GRACE-FO (GRACE-Follow-On) satellite missions and respond to the high priority for mass balance parameters identified in the user survey. The GMB products have the advantage of their direct sensitivity to change in the total ice sheet mass (rather than geometry changes), including fluctuations in snow and ice on an approximately monthly time resolution, though with intrinsic limits in spatial resolution. Results from GRACE and GRACE-FO are available for the periods 2002-04 to 2017-06 and 2018-06 to present, respectively. For the 11-months gap between the two missions, GMB time series are interpolated by utilizing surface mass balance modeling results on short-term mass variations.
Two GMB products are provided: The GMB Basin Product consists of time series of monthly mass changes for individual drainage basins as well as aggregations to the East Antarctic Ice Sheet, the West Antarctic Ice Sheet, the Antarctic Peninsula, and the entire Antarctic Ice Sheet. The GMB Gridded Product provides gridded mass changes over the entire ice sheet. The GMB Basin Product is provided in ASCII format, while the gridded product is available in various formats, such as ASCII, netCDF and GeoTiff. GMB products are hosted by TU Dresden: https://data1.geo.tu-dresden.de/ais_gmb/. User-friendly functionalities allow users to interactively browse and explore both the GMB basin and the GMB gridded product. Mass change time series for individual drainage basins can be displayed by selecting the basin of interest from a map. The time series plot allows us to zoom to a certain period and to query values for a specific monthly solution. The plot can be saved in raster (png) and vector (SVG) formats. An animation of the monthly grid series is available to visualise the GMB gridded product. By selecting a particular month from the plot of the mass change time series for the entire AIS, the corresponding monthly grid is displayed.
Partitioned Gravimetric Mass Balance
Mass changes represented by the GMB product represent the sum of two fundamentally different effects: Effects of changing ice-flow dynamics are controlled by ice-ocean interaction, they are predominantly long-term (decadal and longer) and affect the mass of the whole ice column. In contrast, the effects of variations in surface mass balance (SMB) are controlled by ice-atmosphere interaction. They affect the firn layer and are predominantly short-term, although they may include long-term trends.
The GMB products will be supplemented by Partitioned GMB Products (GMB-P). They will represent a partitioning of the overall mass change into: GMB-P-S: mass balance due to SMB fluctuations around a long-term mean; and GMB-P-D (= GMB minus GMB-P-S): Dynamic and long-term mass balance. This partitioning will utilize modelled SMB fluctuations based on regional atmospheric climate models.
GMB-P will be provided in the same formats as the original GMB Products, that is, as GMB-P Basin Products and GMB-P-Gridded products.
Ice Shelves CoastLine
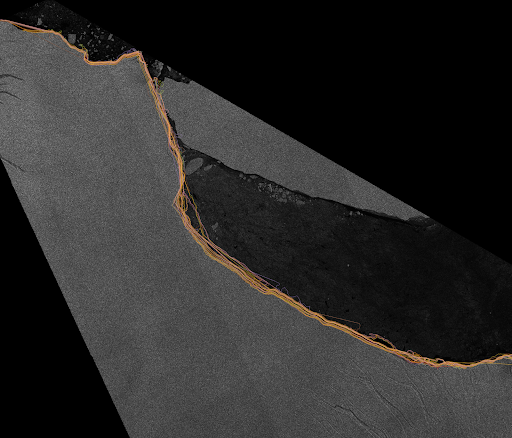
Antarctic Ice Shelves exhibit dynamic and sometimes unexpected daily activity, making the delineation of their coastlines (ISCLs) important to examine the health of the ice shelf and monitor calving. Previous solutions relied only on Radar data, but these solutions exhibit problems in differentiating between the ice shelf and sea ice. This project addresses this problem by developing a deep learning-based method that fuses radar (Sentinel-1) and altimetry (CS2) data to delineate ice shelf coastlines more accurately.The feasibility study focuses on delineating the ISCL between 2018-2022 for Larsen-C, Ronne, and Filchner. Our model significantly improves on the original delineations in fidelity and resolution, even though it used model-created labels from another work done by the DLR called Icelines. It provides monthly delineations of the chosen ice shelves with the native resolution of the Sentinel-1 Extra-Wide (EW) swath image. It anchors the detections and filters them using the CS2 altimetry data, which offers highly accurate elevation measurements that pinpoint precisely where the ice shelf starts and overcome the confusion with sea ice.ISCL lines in the AIS project are provided by S&T Norway and provide a framework for further investigations on how to fuse SAR and altimetry together to create more accurate ice tracking parameters.
Ice Discharge and IOM Mass Balance
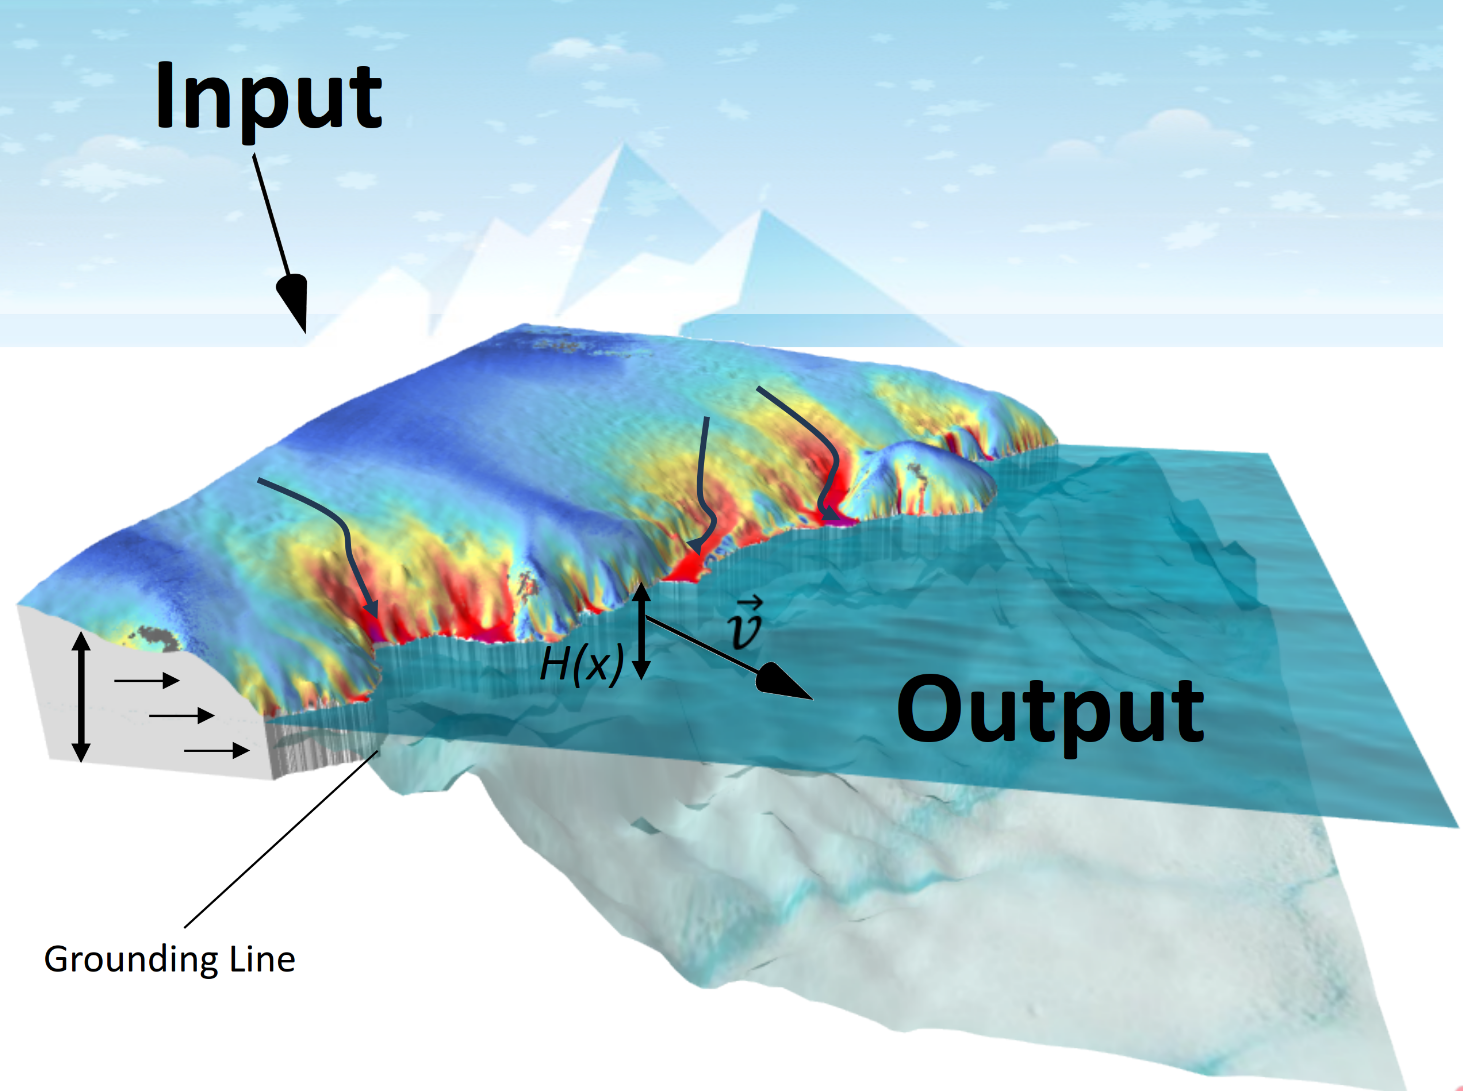
In the current phase of the project, we are developing an advanced system to produce new high-resolution datasets of ice discharge for the East and West Antarctic Ice Sheets, which together account for most of Antarctica’s area and ice mass. Accurate estimates of ice discharge are essential for understanding how these ice sheets are responding to climate change and for assessing their contribution to global sea-level rise.
Ice discharge is calculated by combining detailed ice-velocity maps, generated within the project, with information on ice thickness at the grounding lines of Antarctica’s major outlet glaciers, where ice is transferred from the ice sheet to the ocean. The resulting discharge estimates describe the rate at which ice is exported from the grounded ice sheet.
To quantify overall changes in ice mass, the ice-discharge estimates (output) are combined with modelled estimates of ice input from snowfall, expressed as surface mass balance (SMB). SMB represents the net effect of snow accumulation, melt, refreezing, and sublimation at the ice-sheet surface. By comparing ice input and output through time, we calculate changes in grounded ice mass (mass balance) using the Input–Output Mass Balance (IOM) approach.