
Data
Data Description
Data generated in the Lakes_cci project contain the Lakes Essential Climate Variable products at the global scale, covering the period 1992-2022 or part thereof, where and when data quality are appropriate for climate studies. The current datasets are freely available from the ESA Climate Change Initiative's Open Data Portal.
The main characteristics of the dataset are as follows:
- Daily aggregation interval pinned to 12:00:00 UTC.
- Grid format with spatial resolution of 1/120 degrees (near 1 km at the equator).
- Per-lake variables (LWL and LWE) are duplicated into the grid for the area given under the nominal spatial delineation of that lake, derived from its maximum water extent as used for the variables resolved for the whole lakes grid.
- Datum: WGS84
- Extent: -180 to 180 degrees longitude, -90 to 90 degrees latitude, where positive signs point north and east. The pixel coordinate is the centre of the pixel. This results in 21600 grid rows and 43200 grid columns.
The current, latest version of the dataset is citeable as:
Carrea, L.; Crétaux, J.-F.; Liu, X.; Wu, Y.; Bergé-Nguyen, M.; Calmettes, B.; Duguay, C.; Jiang, D.; Merchant, C.J.; Mueller, D.; Selmes, N.; Simis, S.; Spyrakos, E.; Stelzer, K.; Warren, M.; Yesou, H.; Zhang, D. (2024): ESA Lakes Climate Change Initiative (Lakes_cci): Lake products, Version 2.1. NERC EDS Centre for Environmental Data Analysis, 04 April 2024. doi:10.5285/7fc9df8070d34cacab8092e45ef276f1. https://dx.doi.org/10.5285/7fc9df8070d34cacab8092e45ef276f1
Data Coverage
An important aspect of the project is to provide globally representative data coverage. Some regions have a much higher density of lakes than others. The observability of a water body from satellites largely depends on its size and shape, with the best results achieved in lakes with stretch of open water that are at least 2 km away from the nearest land. The current selection of 2024 target lakes is shown in the following figure.
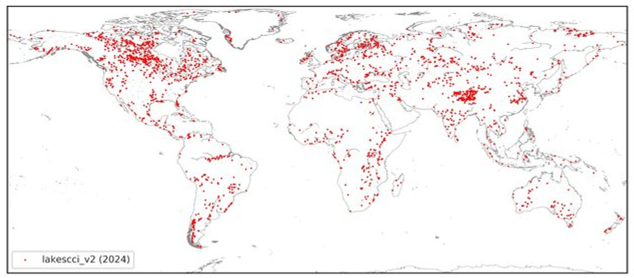
The lakes in the dataset were selected after an iterative process:
- The selection is first based on lake area, starting from the largest lakes and including additional lakes in descending size order.
- Several lakes were then added because there are substantial in situ reference records available, or because they had received priority in closely related activities under Copernicus.
- Some lakes were then excluded from the selection, due to having unsupported morphology, particularly with older sensors, resulting in a lack of valid observations.
Steps 1 and 3 were repeated until we arrived at the current selection.
The list those of lakes, including their location and thematic ECV data availability for version 2.1.0 can be downloaded in csv format (lakescci_v2.1_metadata) or shp format (lakescci_v2.1_shp).
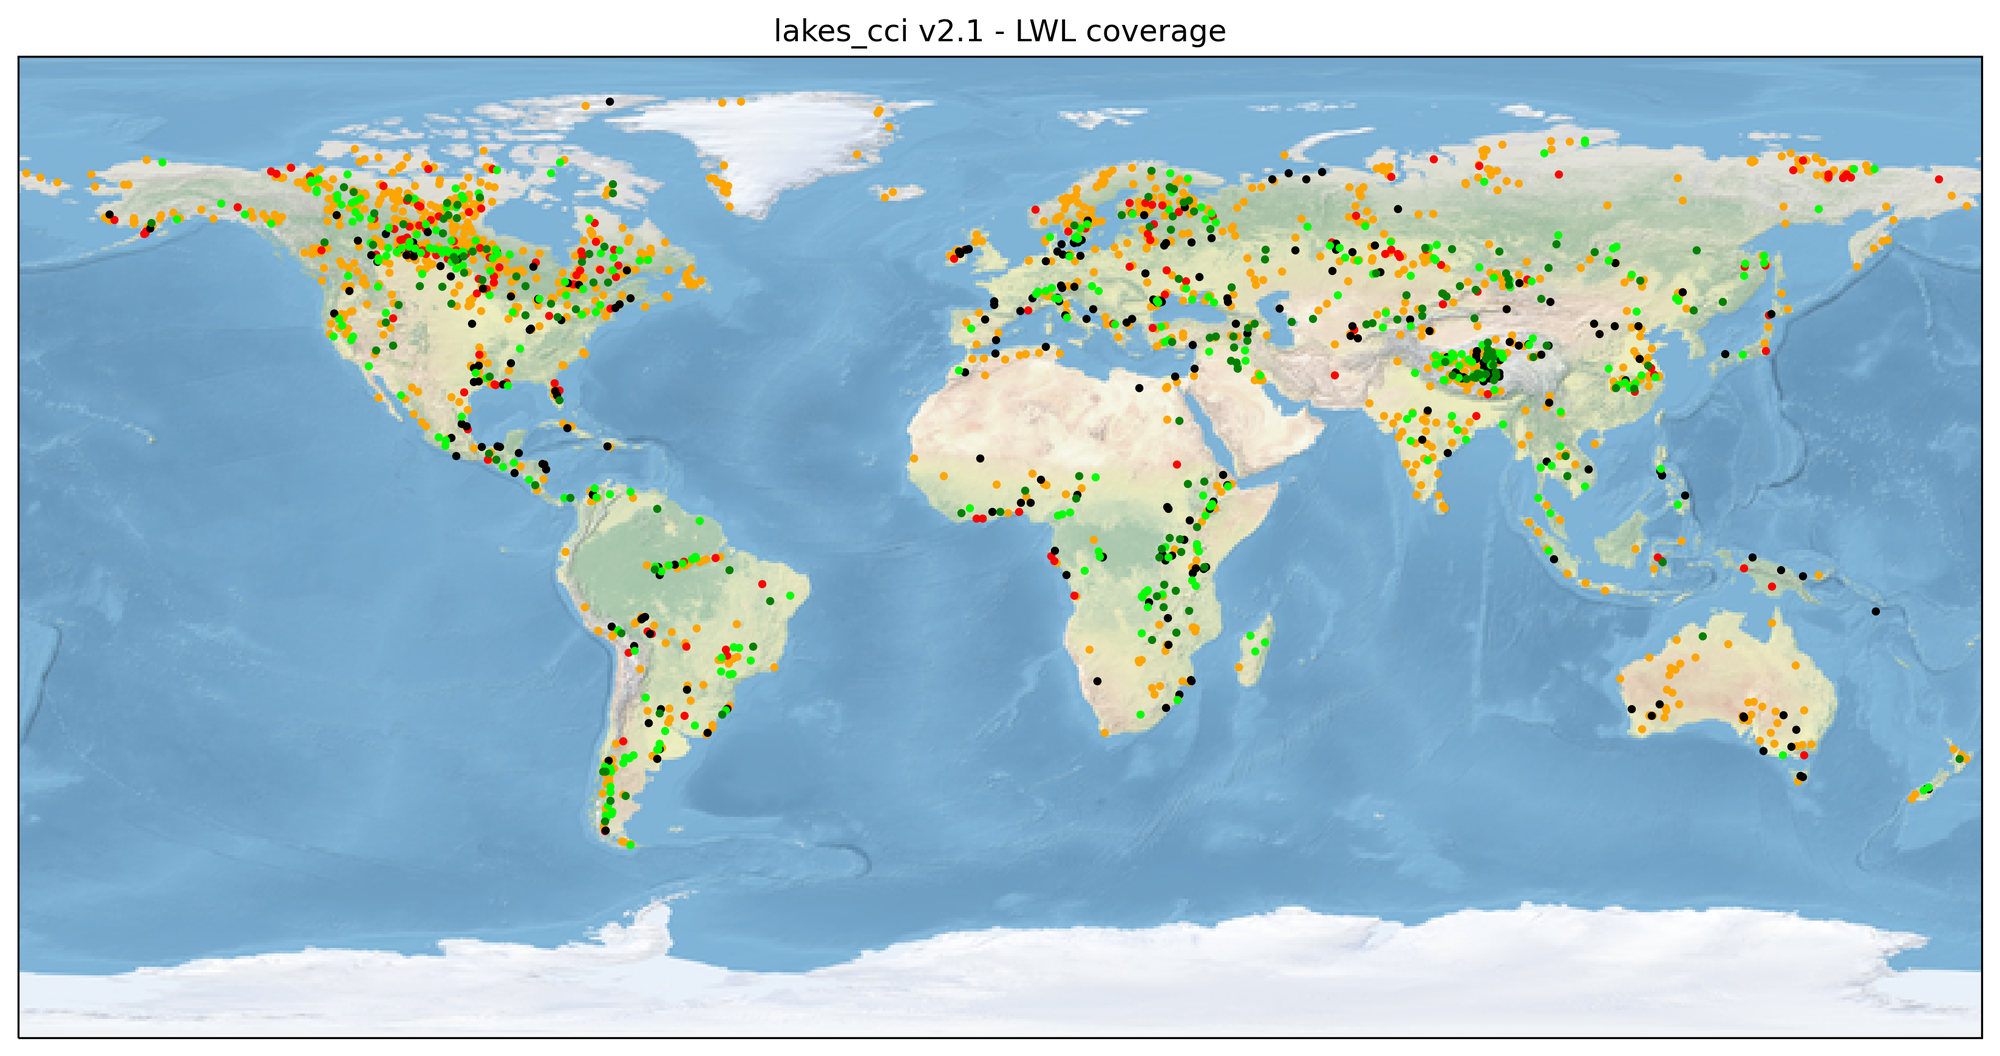
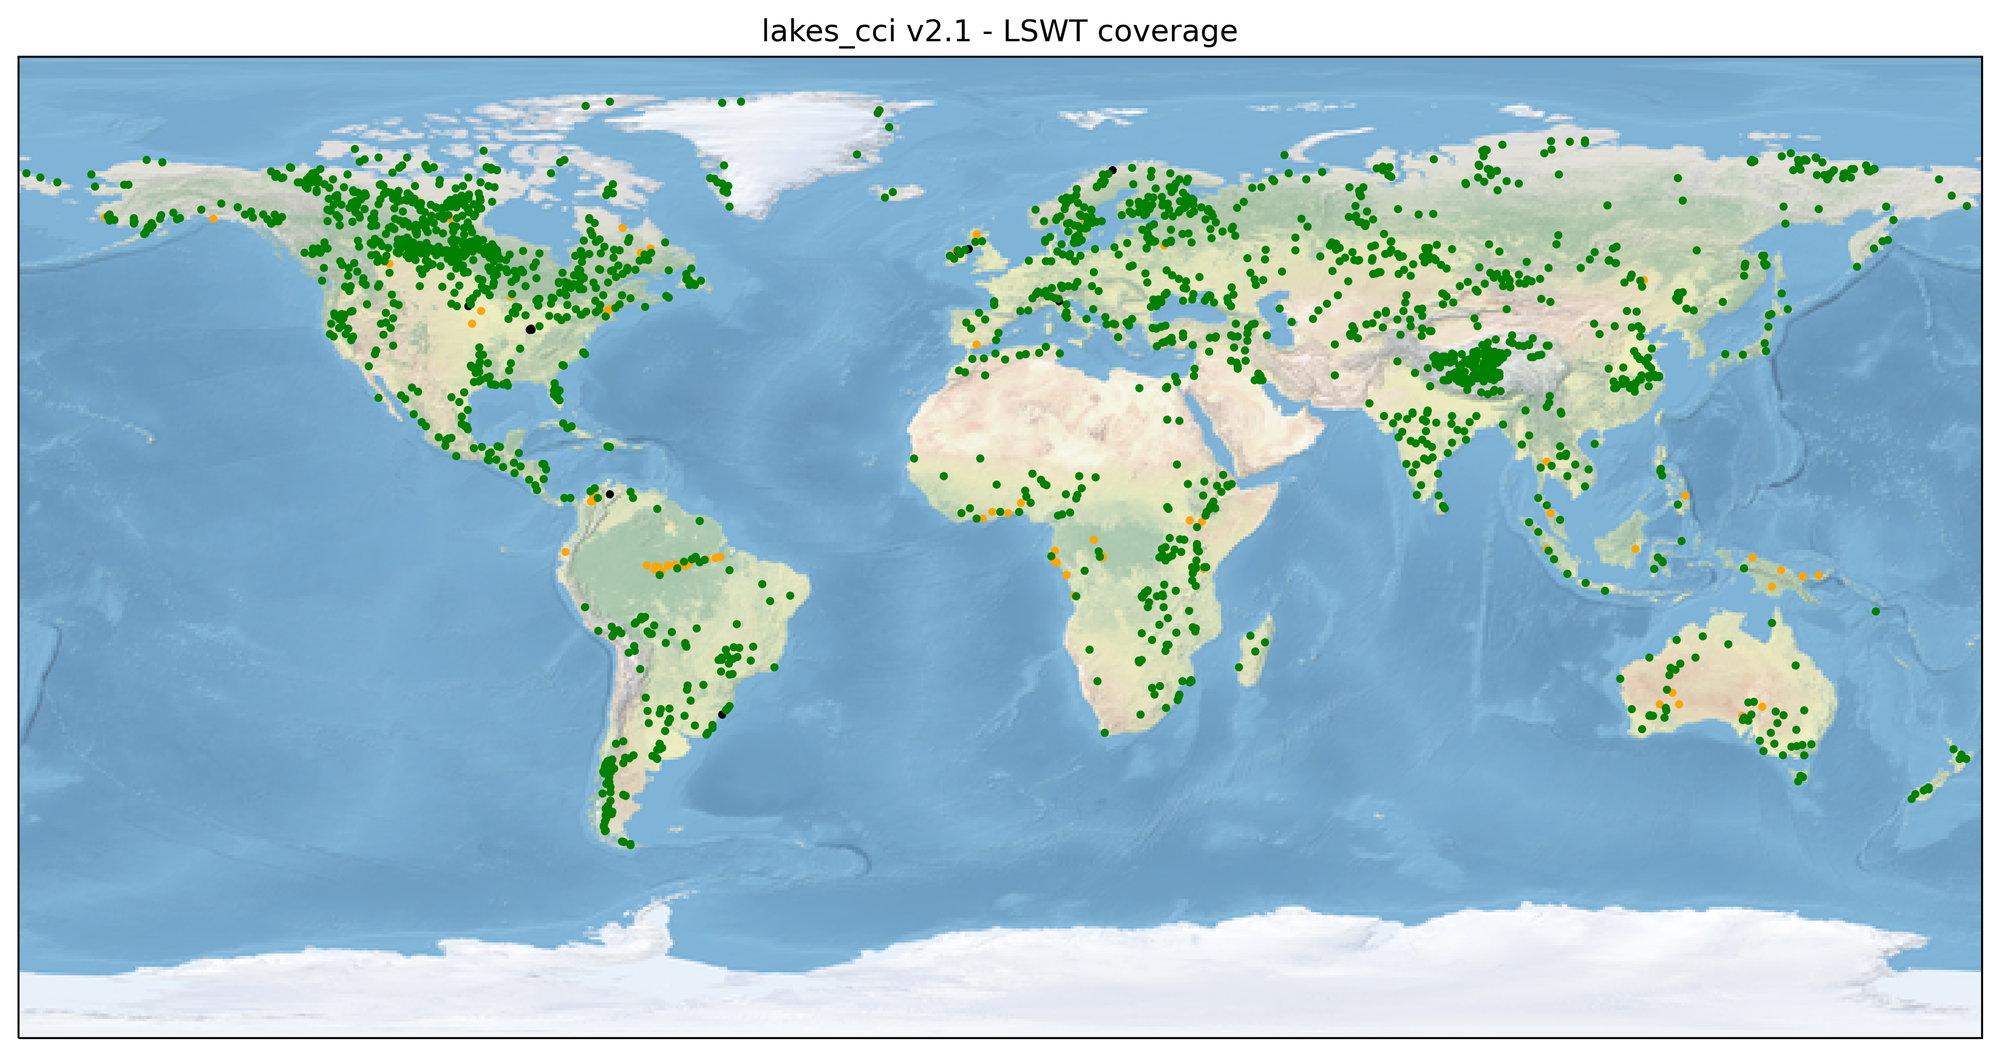
Data used for the generation of the lakes_cci products come from multiple instruments in different satellite missions. Therefore, the temporal resolution and spatial coverage are identical between the lake products. The figures below show the spatial coverage of Lake Water Level, Lake Water Extent and Lake Surface Water Temperature.
Specific observations:
The time interval of Lake Water Level and Lake Water Extent products is satellite dependent, ranging from daily for lakes observed by multiple missions/tracks to 27 days for lakes only observed by a single track of sentinel-3 instruments.
Lake Ice Cover data is available since 2001 for all lakes. However, only lakes that theoretically may form ice in winter are directly observed. A flag product is included to indicate which lakes have been inspected and which have been skipped.
Lake Water Leaving Reflectance data are available for all lakes since 2002. Among them, 48 lakes have complete datasets spanning from 2002 to 2022, while the remaining lakes have a gap in data between 2012 and 2016 due to a gap in usable satellite instruments.
Overall, data availability the can be classified into five categories, visualised per product in the maps below:
- Data available in at least 50% percent of datums in the most recent 16 years – dark green dots
- Data available in fewer than 50% of datums in the most recent 16 years – light green dots
- No observations from relevant satellite instruments – black dots
- No data due to low observation or product quality – red dots
- Lakes being considered for future data releases but not presently included – orange dots
The information on the data availability is included in the lakescci_v2.1_metadata file

Data Access
The official source for the latest version of the lakes_cci dataset (V2.1.0) is at the Centre for Environmental Data Analysis (CEDA): https://catalogue.ceda.ac.uk/uuid/7fc9df8070d34cacab8092e45ef276f1. CEDA offers multiple download mechanisms and ways to extract a set of variables, or data for a specific region.
The v2.1.0 data release combines Lake Water Level, Lake Water Extent, Lake Water-leaving Reflectance, Lake Surface Water Temperature and Lake Ice Cover.
A new variable, Lake Ice Thickness (LIT) is available for a single lake (Great Slave) in this version and is provided in a separate file.
Key improvements made to the ECV Products, compared with the previous dataset, include:
- Lake Water Level: Spatial coverage increased to 498 lakes as well as improved temporal coverage using data from past satellites. This represents approximately 50% of the number of lakes inspected for satellite observation of sufficient quality, to date (921 lakes investigated in total). A product quality variable has been added.
- Lake Water Extent: Spatial coverage increased to 207 lakes (from 84 in v2.0.2). The LWE data are directly linked with LWL observations, for lakes where a hypsometric relationship has been established. Thus, lakes where LWL are not available also do not have LWE estimates.
- Lake Water Leaving Reflectance: improved quality control in periods with ice cover, by clustering the observations of chlorophyll-a and turbidity in relation to LSWT climatology, masking outliers when low temperatures suggest (thin) ice cover is likely. In addition, spectral filters are used to determine the likelihood of adjacent land interfering with lake colour observations. A quality flag has been added describing several data quality risks. For 48 lakes, MODIS-Aqua have been processed to fill the observation gap between MERIS and OLCI instruments.
- Lakes Surface Water Temperature: reprocessed SLSTR-A and SLSTR-B. The reprocessing improved quality, reduced uncertainty and slightly increased the number of observations (in time and space) since all the SLSTR-A and SLSTR-B L1b files were NTC (Non-Time Critical) and therefore consolidated.
- Lake Ice Cover: increased temporal coverage for all lakes.
GitHub tools
To explore some of the ways in which you can extract data for a specific lake or region, we offer a series of python scripts and a jupyter notebook. These are intended to help new users familiarise themselves with data extraction for further analysis: project code repository.
Data Visualisation
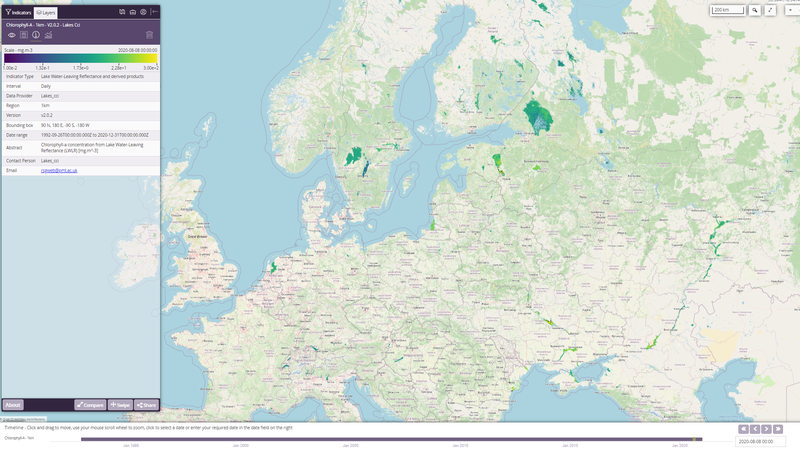
WebGIS
For interactive visualisation of the dataset you can use our WebGIS. The light-weight GIS provides visualisation of most variables (see figure below), and has functionality to extract small sections of the data for download or plotting (for larger requests, please use the CEDA tools). This is also a useful resource for training and education, e.g. by sharing links to your visualisation with others: https://lakescci.eofrom.space/
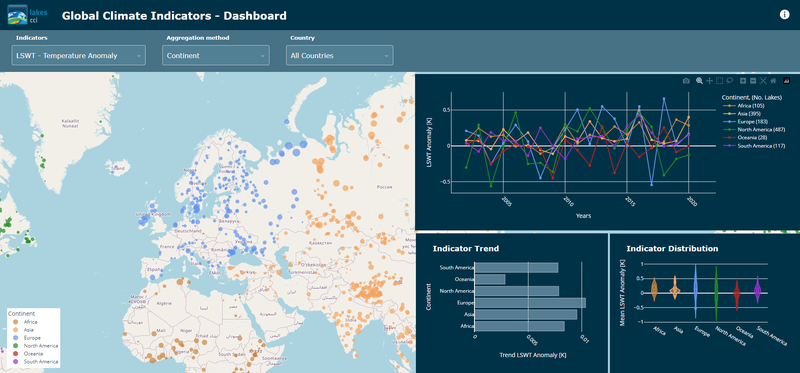
Climate Dashboard
The Lakes_cci Global Climate Indicators Dashboard provides intuitive visualisation of change in lakes using a range of aggregation methods (e.g. per country, continent, by elevation, population pressure). Current indicators include the Lake Surface Water Temperature anomaly, lake heat wave occurrences and change in ice-covered area. The dashboard is hosted at https://lakescci.climate-indicators.brockmann-consult.de and will be extended with additional indicators and functionalities. Anyone interested in additional climate indicators is welcome to contact the developers at info@brockmann-consult.de
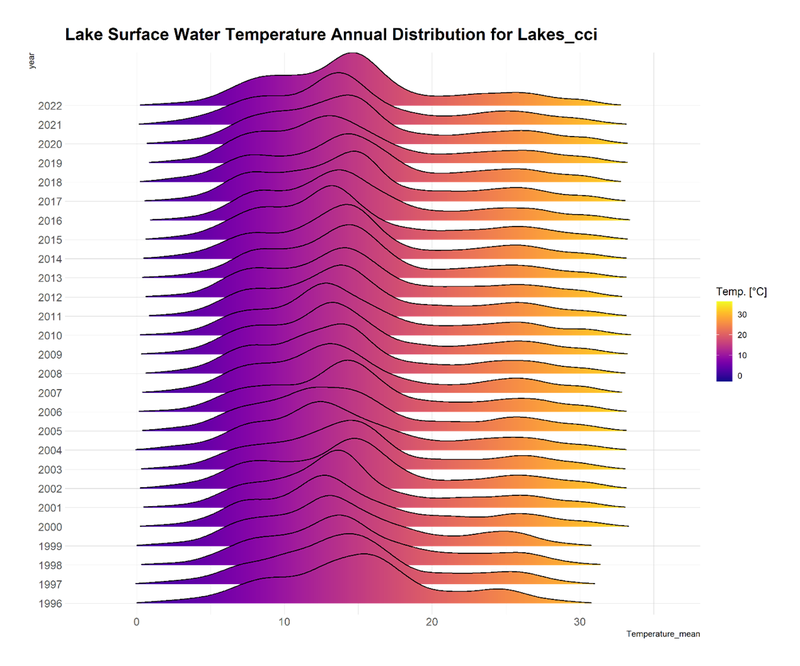
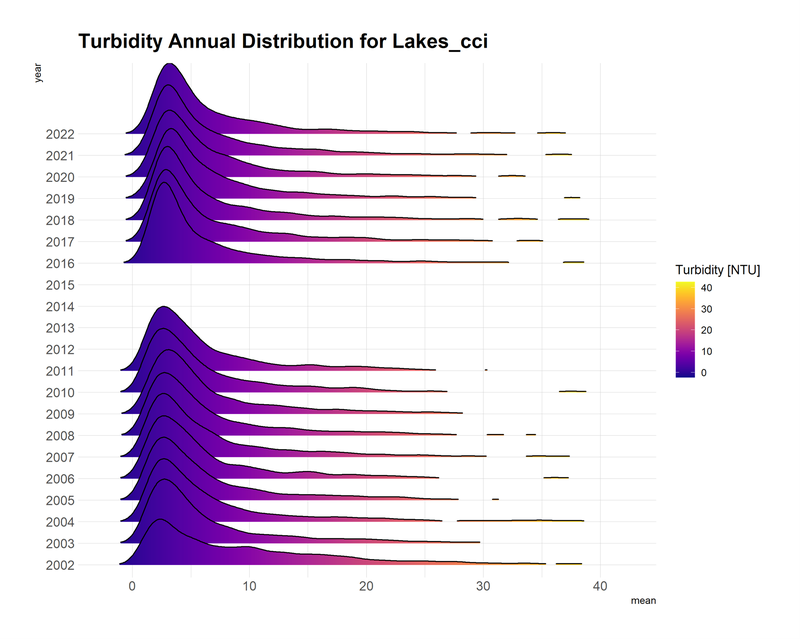
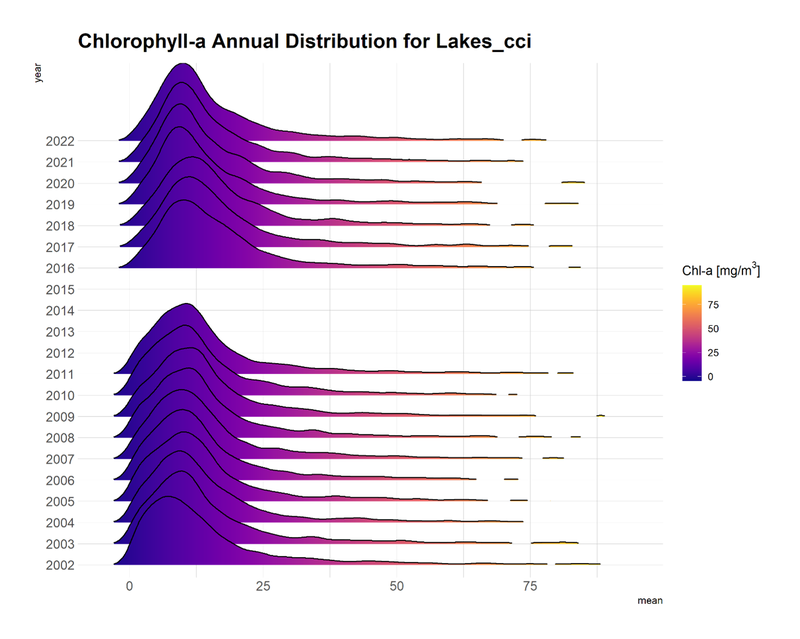
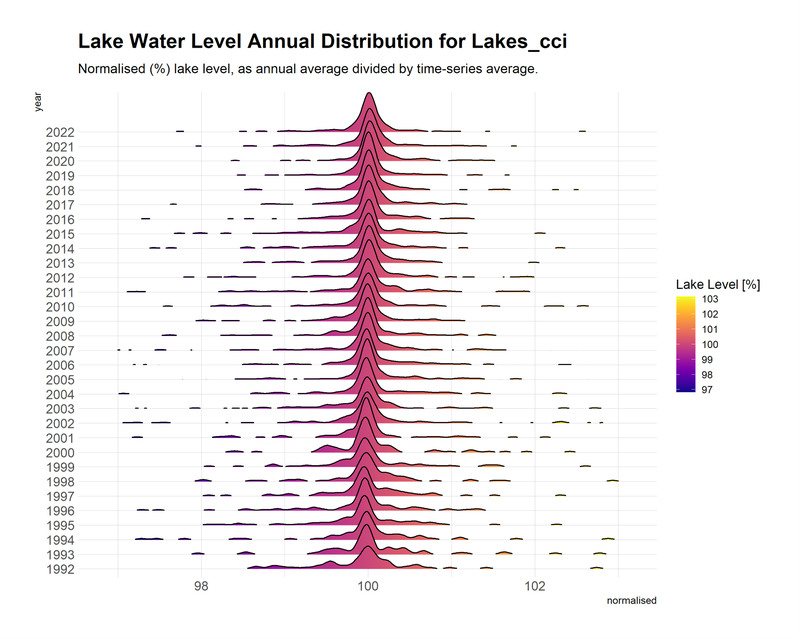
Multidecadal visualisations
The figures below provide a birds-eye view of the latest dataset, showing the annual distribution of Essential Climate Variables across the full dataset.
Please do not hesitate to get in touch for help with the data, or any other project information (lakes_cci@groupcls.com).