
Status & APIs
Status
There are no known current issues with the CCI ECV data dashboard and search.
Programmatic access to all CCI ECV data is available through the following methods -
OpenSearch
Access all CCI ECV data of the CCI Open Data Portal through OpenSearch, a suite of web-based search engine and search protocol standards. An OpenSearch description provides the web interface of the CCI Open Data Portal search engine -
https://archive.opensearch.ceda.ac.uk/opensearch/description.xml
THREDDS
A THREDDS web server provides access to data and metadata on the CCI Open Data Portal via the Web Map Service (WMS) and Web Coverage Service (WCS) standards of the Open Geospatial Consortium and the Open-source Project for a Network Data Access Protocol (OPeNDAP) standard -
STAC
The CCI STAC interface to the CCI ECV catalogue , with collections at ECV and Data Reference Syntax (DRS) level, browsable via the STAC Browser.
https://api.stac.164.30.69.113.nip.io/collections/cci
Earth System Grid Federation (ESGF)
CCI Obs4MIPs datasets are available through the Earth System Grid Federation (ESGF). These provide observational CCI products technically aligned with climate model data, specifically that made available from the Coupled Model Intercomparison Project (CMIP). ESGF provide a RESTful API.
https://esgf.ceda.ac.uk/esg-search/search/?query=CCI
CEOS Federated EO Gateway (FedEO)
The CEOS Federated EO Gateway (FedEO) Clearinghouse provides interoperable access, following ISO/OGC interface guidelines, to Earth Observation metadata. The service periodically ingests the latest CCI Open Data Portal catalogue of all CCI ECV datasets.
ESA Data Discovery Portal
The ESA Data Discovery Portal crawls publicly available metadata of ESA datasets and indexes the metadata, including the CCI ECV catalogue, providing a unified view of all ESA data holdings including in a machine-readable way so it can be processed by search engines that index structured data.
ESA Data Discovery Portal
The ESA Data Discovery Portal crawls publicly available metadata of ESA datasets and indexes the metadata, including the CCI ECV catalogue, providing a unified view of all ESA data holdings including in a machine-readable way so it can be processed by search engines that index structured data.https://data.esa.int/
CCI ECV Traceability to ECMWF and EUMETSAT
The CCI Data Bridge API provides dataset-level traceability, from the CCI ECV datasets of the CCI Open Data Portal to operational services (ECMWF C3S, EUMETSAT OSI SAF, EUMETSAT CM SAF). The mapping from CCI ECV datasets to operational ECV datasets is defined by seventeen relationship types.
Toolbox
Welcome to the CCI Toolbox!
The Toolbox is a powerful Python package designed to help you access and analyse global long-term data records generated via the ESA Climate Change Initiative (CCI). It is available on GitHub and can be installed with Conda and PyPi.
Whether you are exploring environmental datasets or conducting climate research, the Toolbox
- gives rapid access to decades of satellite climate data records for a suite of GCOS-defined Essential Climate Variables (ECVs)
- streamlines data manipulation and analysis
- facilitates analysis with third party data resources in an integrated python environment.
Head over to the Quick start-section to dive in immediately.
Access ESA climate data records
Our Toolbox offers seamless data discovery, metadata inspection and operators to support analysis, and visualisation using Python-native formats such as xarray and geopandas. A dedicated API will support you in finding and opening the right data for your purpose in its appropriate format.
Datasets are provided as
- xarray Datasets (gridded data)
- geopandas GeoDataFrames (vector data) or
- Vector Data Cubes (a hybrid of gridded and vector data).
Streamline your data workflow
Toolbox operations range from outlier detection, resampling, coregistration, and time series extraction to support your workflow. Thanks to its close integration with Python's scientific stack, the Toolbox enables users to perform advanced climate data analysis with ease.
In addition, the Python packages xarray, pandas, and geopandas provide a rich and powerful low-level data processing interface for datasets opened through the CCI Toolbox. Please have a look at the API reference for details.
Quick start Notebooks
To get up and running we have developed a series of quick start Jupyter Notebooks that will allow you to start working immediately, either locally or via the ESA Climate Change Initiative Jupyter Lab.
To help you further, the Toolbox documentation’s Quick Start aims to assist with onboarding, answer frequently asked questions and show you how to achieve various tasks such as:
- List and search for climate datasets
- Define the appropriate subset for your purpose
- Access data in well supported structures like xarray datasets
- Discover all operations of the Toolbox and Climate Change Initiative data
We invite you to try the ESA CCI Jupyter Lab, where you will find the latest and maintained versions of the Toolbox, Notebooks, and required software. Just register – for free – with your email or GitHub account.
If you would like to explore a particular ECV project in more detail, try the Examples Explorer within Jupyter Lab! We have created helpful Notebooks that provide direct access to specific datasets. These are conveniently organised, ready for you to start working with.
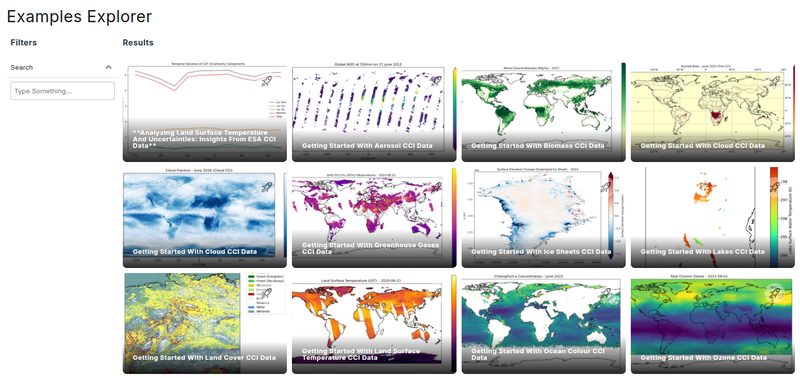
Quick looks are available for:
Installation
You can also install the Toolbox on your local machine following the steps in this section.
Ready to dive in? Choose the path that fits your setup and paste the commands into your terminal. You’ll be up and discovering climate data in no time.
Method 1 – Start fresh with Conda
If you want a clean, dedicated setup:
$ conda create --name ect --channel conda-forge esa-climate-toolbox
$ conda activate ect
Method 2 – Add to an existing Conda
If you already have an environment activated:
$ conda install --channel conda-forge esa-climate-toolbox
Method 3 – Install from GitHub (latest source)
Great if you want the newest changes or plan to contribute:
$ git clone https://github.com/esa-cci/esa-climate-toolbox.git
$ cd esa-climate-toolbox
$ conda env create
$ conda activate ect
$ pip install -e .
Method 4 – Install with pip
The quick pip route:
$ pip install esa-climate-toolbox
Our interactive Jupyter Notebooks walk you through the essentials: find your data, subset it, work with modern formats, discover tools and available options as well as hands-on examples. Each Notebook is designed to get you comfortable with the Toolbox, step by step. Perfect for beginners and experienced users alike. Get started!
Get help & connect
Stuck on something? Have a brilliant idea? Our support team is here to help you succeed. Whether you're troubleshooting, exploring new features, or sharing what you've discovered – we'd love to hear from you.
Visit our Helpdesk.
Policy & Standards
CCI Data Policy
The CCI Data Policy ensures free and open access to CCI data. The policy is available here.
CCI Data Standards
The CCI Data Standards are community-driven requirements ensuring consistent essential climate variable (ECV) data production across the CCI programme. Version 2.3 is the latest. The requirements include data production conformance to the network Common Data Form (netCDF) format, the Climate and Forecasting (CF) metadata conventions, the Attribute Convention for Data Discovery (ACDD), and Infrastructure for Spatial Information in the European Community (INSPIRE) compliant discovery metadata.
CCI Ontology
To ensure consistency where the same global attributes apply to all CCI essential climate variables (ECVs), and to avoid different terms being used for the same entity, relevant terms have been gathered in a CCI Ontology defining all CCI entities and the relationship between those entities, including CCI project, platform, sensor and institution. For example, the ontology defines common entities for the satellite platforms used across the CCI projects in their data production.
About
Established by ESA in 2008, the Climate Change Initiative (CCI) is a major science programme focused on developing global, decadal-long satellite-derived climate data records. Collectively, these data provide a major contribution to the Intergovernmental Panel on Climate Change (IPCC) assessment of the state of the climate and underpin the climate value information chain that inform effective policy, decision-making and action.
The CCI programme leverages a 40-year satellite data archive from ESA and its Member States, including current ESA missions, the Copernicus Sentinels, ESA third-party missions, and agency partners including NASA, NOAA, JAXA, and EUMETSAT. The CCI programme produces datasets for Essential Climate Variables (ECVs), critical for climate monitoring as defined by the Global Climate Observing System (GCOS) and required by the United Nations Framework Convention on Climate Change (UNFCCC) to systematically monitor the Earth system. Satellite observations form the backbone of GCOS, with two-thirds of the 55 ECVs primarily measured from space. As of January 2024, the CCI has contributed to records for 27 ECVs, marking a significant impact on understanding Earth's climate system.
CCI Open Data Portal
The CCI Open Data Portal is the data management facility of the CCI programme. It offers free, open and easy access to all CCI data via a user-friendly dashboard, a faceted search interface, OpenSearch, OPeNDAP, ESGF, WMS, WCS, HTTPS and FTP. The facility also forms part of the CEOS Federated Earth Observation Gateway (FedEO) and the ESA Data Discovery Portal.