
The amount of carbon dioxide in the atmosphere is increasing, largely due to the burning of fossil fuels.
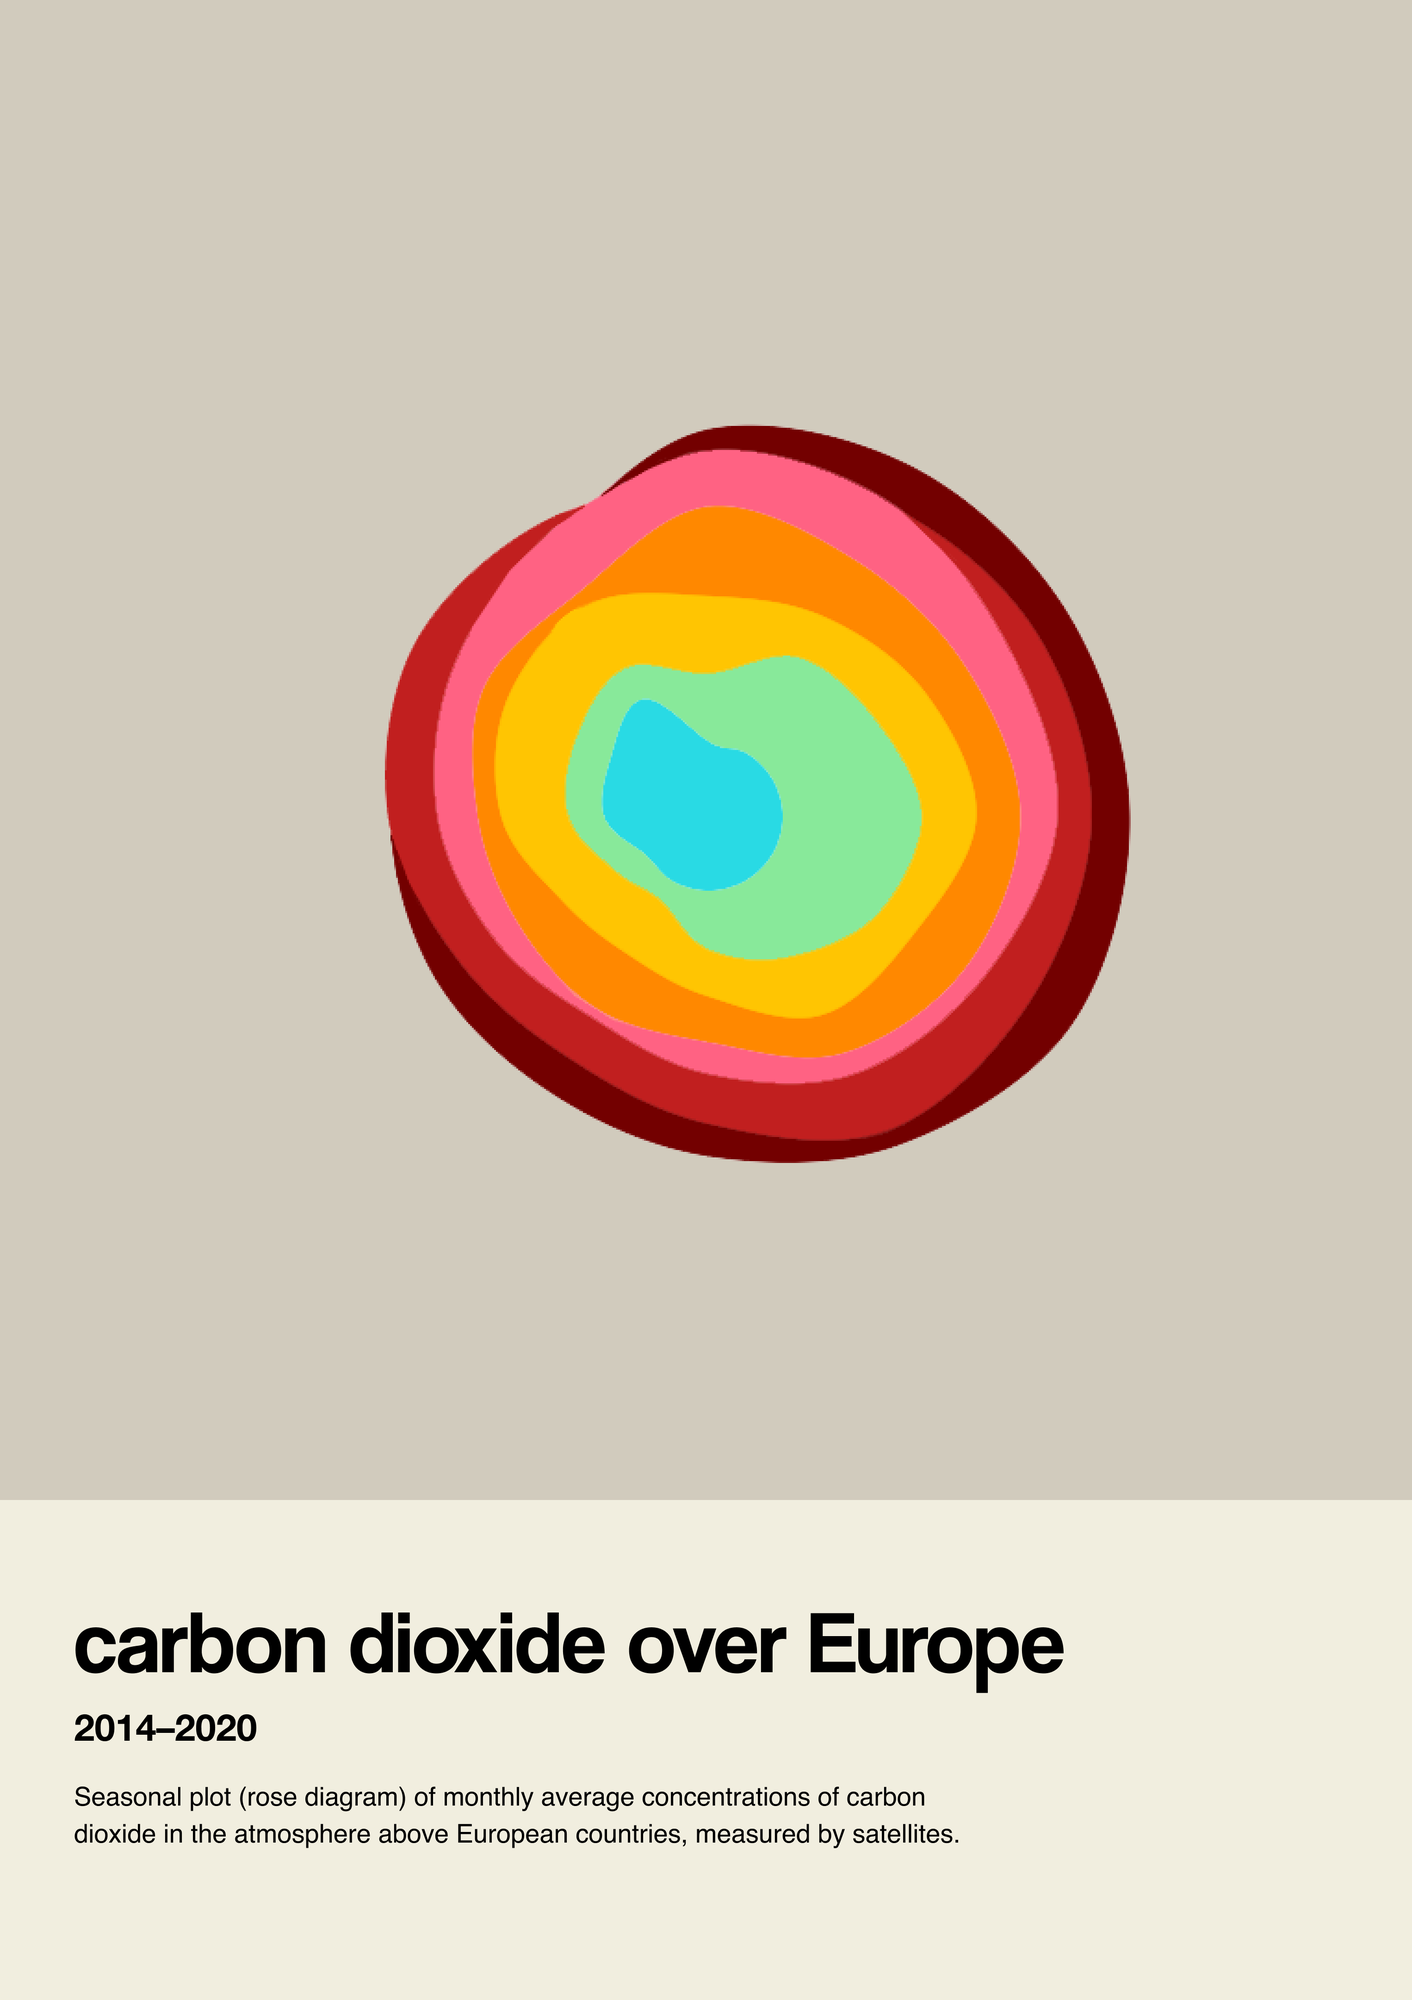
This seasonal plot (or rose diagram) to show the monthly average concentration of carbon dioxide in the atmosphere over European countries, measured by satellite, from 2014 (light blue) to 2020 (dark red). The concentration has been above 400 parts per million (ppm) since September 2016. The plot is asymmetric, due to the absorption of carbon dioxide by growing plants in the summer months.
About
This Little Picture uses a seaonal plot (or rose diagram) to show the monthly average concentration of carbon dioxide in the atmosphere over European countries, measured by satellite, from 2014 (light blue) to 2020 (dark red). The concentration has been above 400 parts per million (ppm) since September 2016. The plot is asymmetric, due to the absorption of carbon dioxide by growing plants in the summer months.
Data
This Little Picture uses the following datasets:
- https://github.com/littlepictures/datasets/commit/62aefa2839cb624d31d3dbe17d33d1308c42c60f
- ESA Greenhouse Gases Climate Change Initiative (GHG_cci): Column averaged carbon dioxide from OCO-2 generated with the FOCAL algorithm, version 10
Licence
This little picture is published under CC BY-SA 4.0 licence.
The big picture
The European Space Agency (ESA), the European Centre for Medium-Range Weather Forecasts (ECMWF), and the European Organisation for the Exploitation of Meteorological Satellites (EUMETSAT) work closely together to measure, process & make space-derived information about the climate available.
ESA
The mission of the Climate Change Initiative (CCI) is to realise the full potential of the long-term global Earth Observation archives that the European Space Agency (ESA), together with its Member states, has established over the past 40 years, as a significant and timely contribution to the climate databases required by the United Nations Framework Convention on Climate Change. The ESA Climate Office provides a free & open CCI data facility bringing together ECV data from across its twenty-seven climate science projects, including a CCI Data Standards and a CCI Toolbox.
ECMWF
The Copernicus Climate Change Service (C3S) supports society by providing freely available authoritative information about the past, present and future climate in Europe and the rest of the World. C3S is one of the six thematic information services provided by the Copernicus Earth Observation Programme of the European Union, and has been entrusted by the European Commission to the European Centre for Medium-Range Weather Forecasts (ECMWF). One of the core components of C3S includes the Climate Data Store (CDS). This is a one-stop shop for climate information. It provides free and easy access to a wide range of climate datasets via a searchable catalogue. A freely available online toolbox allows users to build workflows and applications suited to their needs.
EUMETSAT
EUMETSAT operates missions both to provide weather and climate data for its member states, and as an entrusted entity under the Copernicus programme. Several missions are operated collaboratively with ESA, providing complimentary expertise and data processing, to process and distribute land, marine, and atmosphere relevant products for users. Data from EUMETSAT operated missions is frequently available in near-real-time, facilitating rapid monitoring and forecasting. Via EUMETCast, the EUMETSAT Data Services, or WEkEO, users can access data in ways that suit their needs. The data is used by the EUMETSAT satellite applications facilities, as well as across the various Copernicus Services.
next