
Data
This section provides access to various datasets published by the Greenland Ice Sheet ECV project.
NOTE: from Janaury 2025 old and newly generated products can only be found on the websites of the Partners:
- Surface Elevation Change (SEC) from ERS-1, ERS-2, Envisat, CryoSat-2 and Sentinel-3 data by DTU Space
- Monthly surface elevation changes from CryoSat-2 data (dSEC) by DTU Space
- 2014-present Greenland ice velocity (IV) timeseries from Copernicus Sentinel-1 SAR by ENVEO
- Greenland Icesheet CCI Experimental Ice Uplift/Subsidence from InSAR Line-of-sight velocity by DTU-N
- Ice Velocity from Sentinel-2 data for 9 outlet key glaciers by S&T NO (OptIV)
- Gravimetric mass balance of the Greenland Ice Sheet from the GRACE and GRACE-FO satellite gravimetry mission by TU Dresden
- Greenland mass balance (GMB) product for the Greenland Ice Sheet from GRACE(-FO) satellite gravimetry (CSR RL06) by DTU Space, computed with the mass point inversion method
- 2014-2023 Mass Flux Ice Discharge based on IV and SEC by GEUS.
- Greenland Ice Sheet CCI Experimental SupraGlacial Lakes (SGL) volume estimate from Sentinel-2 and IceSat-2 missions by S&T NO
Samples of the project's datasets are also available on the ESA Climate Office Open Data Portal.
Surface Elevation Change
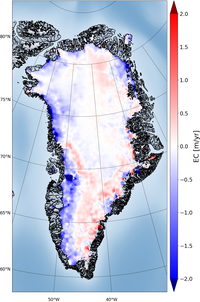
The surface elevation change (SEC) is a direct expression of climate change and is closely linked to the mass balance of the ice sheet. The SEC is a key essential climate variable and is a direct measure of the imbalance between the atmospheric forcing and ice sheet dynamics. In the Greenland CCI project, SEC is derived from present and past ESA radar altimetry missions, and validated by optical data (such as NASA’s IceSat).
The era of ESA altimetry missions was initiated with ERS-1 in 1992, and data from ERS-2, Envisat, CryoSat-2 and Sentinel-3 have contributed to an unbroken time series from then to the present. At present, there are multiple satellites in orbit (Cryosat-2, Sentinel-3A and Sentinel-3B) contributing to the time series; the latter is ensured to be continued, with the operational approach of the EU Sentinel programme.
The nature of the radar measurements enables surface penetration in the interior parts of the Greenland ice sheet and the radar measures a reflecting surface within the upper two meters of the snow cover, rather than the snow-air interface.
As a by-product of the work on SEC products, a Digital Elevation Model for Greenland has also been generated.
Ice Velocity
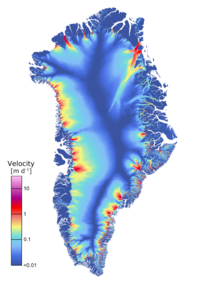
Ice velocity and its spatial derivative strain rate (which is a measure of the ice deformation rate) are key variables for estimating ice discharge and mass balance and are essential input for glacier models that try to quantify ice dynamical processes. Changes in velocity and velocity gradients can point to changing boundary conditions. Remote sensing techniques that utilise SAR and optical satellite data are the only feasible manner to derive accurate surface velocities of the remote Greenland glaciers on a regular basis.
The ice velocity (IV) products generated in the Greenland Ice Sheet CCI are derived from both optical and SAR data using combinations of different techniques. Details of the methods are provided in the Algorithm Theoretical Basis Document (ATBD).
Ice velocity is provided as gridded velocity fields (maps) in NetCDF format with separate files for x and y velocity components (in m/d). The velocity represents a mean velocity value over a time period ranging from the time span of the satellite repeat cycle (between 1 to 46 days) to a full season or year for the ice sheet-wide velocity maps.
Grounding Line Location
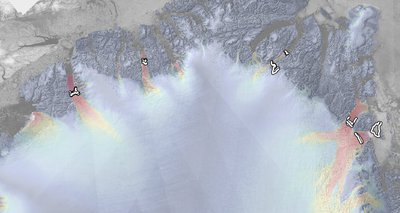
The grounding line location (GLL) marks the position where an ice sheet or marine-terminating glacier starts to float. Understanding the processes at the grounding line of outlet glaciers is important in order to predict the response of the ice to changing boundary conditions and to establish realistic future scenarios in response to climate change.
Remote sensing observations do not provide direct measurements of the grounding line position but can be used to detect the tidal flexure zone, using InSAR data, or spatial changes in texture and shading, using optical images, which are indicators of the transition from grounded to floating ice. Due to the plasticity of ice, these indicators usually spread out over a zone upstream and downstream of the actual grounding line, also called the grounding zone.
In the Greenland Ice Sheet CCI, the GLL is derived from InSAR data by mapping the tidal flexure zone visible in interferograms. It is generated for selected glaciers with a floating ice tongue.
Click here to browse and download Grounding Line Location products
Products by ENVEO are also available directly from http://cryoportal.enveo.at/.
Gravimetric Mass Balance
The Gravity Recovery and Climate Experiment (GRACE) twin satellites have been measuring changes in the Earth’s gravitational field between 2002 and 2017. Its follow-on mission GRACE-FO continues the time series since 2018. Time-variable gravity fields can be used to infer mass changes and mass redistributions in the Earth’s subsystems (e.g. the cryosphere). Mass variations of the Greenland Ice Sheet (GIS) can be measured with an accuracy of around 20 Gt/yr. In order to meet the IGOS (Integrated Global Observing Strategy) requirements as outlined in the GCOS-154 document systematic observation requirements for satellite-based data products for climate - 2011 Update: Supplemental details to the satellite-based component of the “Implementation Plan for the Global Observing System for Climate in Support of the UNFCCC (2010 Update)”, the Greenland Ice Sheet cci (GIS_cci) produces li Mass Balance (GMB) products for the Greenland Ice Sheet from GRACE and GRACE-FO measurements. These products comprise monthly mass change time series for the entire GIS and different drainage basins as well as gridded mass change trends over different 5-year periods between.
GRACE/GRACE-FO data are available from different processing centres, including the Center for Space Research (CSR) at University of Texas, and the GeoForschungsZentrum (GFZ). Here, we use the CSR RL06 solution series (http://www2.csr.utexas.edu/grace/RL06.html), which includes spherical harmonic coefficients up to degree lmax=96.
Monthly spherical harmonic coefficients of changes in the Earth’s gravity field are available for the mission period. Different processing algorithms exist in order to derive the required information from the available data for the GIS. The round robin (RR) exercise carried out during the second phase of GIS_cci by TU Dresden has confirmed that the mass inversion and spherical harmonic filtering methods give comparable results.
The GIS GMB setup is primarily based on the inversion method, applied by DTU Space, where a direct estimate of mass changes are done in a direct least-squares generalized inverse processing. The choice of this method secures consistency with the current Danish Polar Portal data (http://polarportal.dk). Details of the inversion method is outlined in the ATBD document. In addition, a second GMB product based on the regional integration approach using tailored sensitivity kernels is provided by TU Dresden.
As specified in the User Requirements Document (URD), user requirements for a gravimetric mass balance product (GMB) were found through a user survey for the Antarctic Ice Sheet cci (AIS_cci). The results were adopted for the GIS_cci. The product requirements for the GMB product are outlined below:
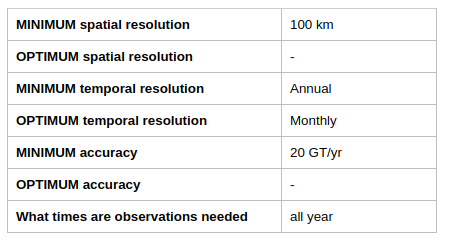
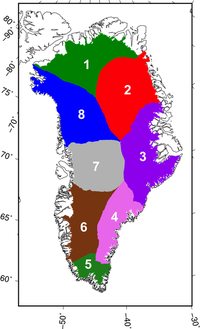
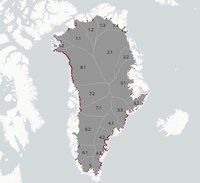
The drainage basins used are an aggregation of those described by Zwally et al. (2012). The figure below shows the outline of the basins. They are also employed for the GMB RR exercise.
Click here to browse and download Gravimetric Mass Balance products.
Products by TU Dresden are also available directly from https://data1.geo.tu-dresden.de/gis_gmb/.
Mass Flow rate Ice Discharge
The mass flow rate and ice discharge (MFID) product generated in the Greenland Ice Sheet CCI are derived from the CCI ice velocity (IV) product, the CCI surface elevation change (SEC) product, and ice thickness from BedMachine. Ice discharge gates are placed 10km upstream from all marine terminating glacier termini that have baseline velocities of more than 150 m/yr. Results are summed by Zwally et al. (2012) sectors. Full details of the methods are provided in the Algorithm Theorotical Basis Document (ATBD) or in Mankoff et al. (2019).
The following figure shows the sectors and gate locations within each sector.
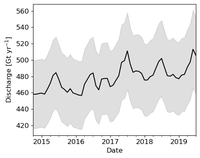
MFID is provided as a time series CSV file where each column represents one sector from with units in Gt/yr. Additional files provide error estimates and coverage (a measure of gap-filling).
Click here to browse and download Mass-Flow rate Ice Discharge products.
The product is generated by GEUS.
Supraglacial Lakes
Supraglacial Lakes (SGL) are meltwater lakes that form in depressions at the surface of the ice sheet in the ablation zone. Supraglacial lakes are indicators of surface melt and are a major component of the routing and storage of meltwater at the ice sheet surface. These play an important role in the delivery of meltwater to the base of the ice sheet. The delivery of water to the base of glaciers and ice sheets has been observed to influence basal sliding on a range of spatiotemporal scales, as well as play a pivotal role in the seasonal evolution of the subglacial drainage system.
A new R&D SGL product is currently under development by S&T. It will be generated by a deep learning-based model combining ICESat-2 and Sentinel-2 data. More specifically, this new ECV will be a dataset containing lake extent and lake depth estimates for the 2019 meltwater season within the two catchment areas in North-East Greenland (79 and Zacharia). If successful, the model may be rolled out onto other areas where there are sufficient labels, such as southwest Greenland.
The dataset will be generated using a deep learning algorithm which uses a U-Net architecture (Ronneberger et al., 2015) which is trained on Sentinel-2 optical imagery, lake extent labels and partial lake depth labels (mentioned below). The algorithm is trained to “learn” features of the optical imagery in order to predict lake extent and depth.
Click here to browse and download SupraGlacial Lakes products.
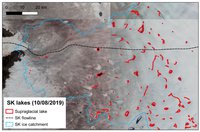
The SGLs can also be derived using more traditional methodologies. During the first phase of the project, a prof-of-concept for a new R&D product was developed. It was derived from Sentinel-2 optical data using an automated Normalised Difference Water Index (NDWI). These products are produced for selected regions of interest, and version 1.1 is for the Sermeq Kujalleq (Jakobshavn Isbrae) hydrological catchment, as defined by Mankoff et al. 2020. The lake outlines are stored as standard vectorised polygons, with additional metadata stored in the attribute table. The detected lakes are filtered according to maximum recorded surface area and a mask of SGL basins from DEM sink filling is applied to remove false positives.
A more detailed description of the product, including an analysis of elevation and individual lakes, is available in the product report.
The product was an R&D CCI+ activity and it was generated by Asiaq (Greenland).
Calving Front Location
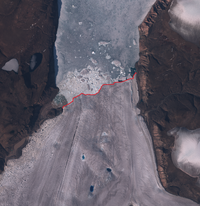
The Calving Front Location (CFL) of outlet glaciers from ice sheets is a basic parameter for ice dynamic modelling, computing mass fluxes and mapping glacier area change. From the ice velocity at the calving front and a time sequence of Calving Front Locations, the iceberg production rate can be computed, which is of relevance for estimating the export of ice mass to the ocean.
The CFL product is generated by a deep learning-based model using optical satellite imagery (Sentinel-2). The digitized calving front is stored as vector lines in standard GeoJSON files. Additionally, metadata information on the sensor and processing steps are stored in corresponding attributes in the GeoJSON files. GeoJSON is an open standard format designed for representing simple geographical features (points, line strings, polygons, and collections), along with their non-spatial attributes.
Click here to browse and download Calving Front Location products
Products by Science [&] Technology AS.
The CFL can also be derived by manual delineation using SAR and optical satellite data. The digitised calving front is stored as vector lines in standard GIS format. Additionally, metadata information on the sensor and processing steps are stored in the corresponding attribute table. In accordance with the URD, the vector files are provided in ESRI shape-file format. This product is currently not in production.
Click here to browse and download Calving Front Location products
Products by ENVEO are also available directly from http://cryoportal.enveo.at.