walk-through tutorials
To help you create your own data-driven Little Pictures, we provide three step-by-step tutorials that guide you through the necessary steps to access and manipulate data to create beautiful, easy to understand, and publication-quality graphics based on satellite-derived climate datasets provided by ESA, ECMWF and EUMETSAT.
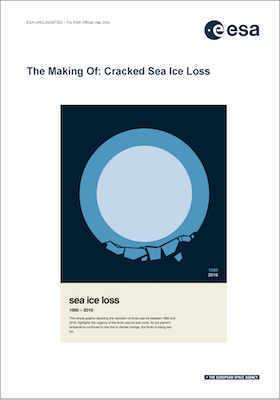
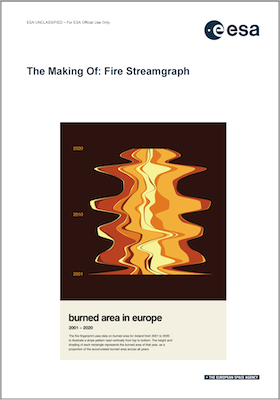
The first tutorial shows how to set up a Python and Jupyter Notebook on your machine. Tutorials two and three can be used to practice your new skills and re-create our ‘Cracked sea ice’ and ‘Fire streamgraph’ Little Pictures.
ready to create your own little picture?
We have prepared a suite of easy-to-access satellite datasets in CSV format. They are available on github and cover various aspects of the climate that are monitored from space, such as sea level, arctic sea ice, atmospheric greenhouse gas concentrations and wildfire.
If you are an advanced climate data user, you may wish to access the full climate records from the ESA Climate Data Portal, the C3S Climate Data Store and the EUMETSAT data store.
choosing your tools
To create our Little Pictures, we have made good use of the Python programming language using Jupyter Notebook to 'wrangle' data. We like it as it is open source, widely used by both the climate science and data journalism communities and caters for the hardcore professional and hobbyist alike. Around half of our Little Pictures are derived from Python alone. However, the rest were created using a range of software and data-viz apps such as Datawrapper, Observable, D3, CodePen & Tableau and graphic design software such as Adobe Illustrator and Pixlr.
Feel free to use whichever tools, software or programme language work best for you to generate your own Little Picture.
Little Picture competition
Create a Little Picture and enter our competition (now closed) to be in with a chance to showcase your climate data visualisation talent at COP28 and win an expenses paid tour of ESA's data-visualisation suite, the phi experience, Frascati, Italy.