Terrestrial vegetation plays a major role in the climate system through primary productivity by photosynthesis and respiration, recycling of precipitation, and soil formation. Two essential climate variables (ECVs) that describe the state of the vegetation are the Leaf Area Index (LAI) and fraction of incident surface solar radiation in the photosynthetically active region (0.4-0.7 μm) absorbed by vegetation (FAPAR). Consistent, global time series of LAI and FAPAR can provide insight into the dynamic role of vegetation in the Earth's climate.
The Leaf Area Index (LAI) of a plant canopy or ecosystem, defined as one half of the total leaf area per unit horizontal ground surface area, determines the size of the interface for exchange of energy (including radiation) and mass between the canopy and the atmosphere. It also partly controls photosynthesis and respiration. Monitoring its distribution and changes is important for assessing growth and vigour of vegetation on the planet.
FAPAR plays a critical role in assessing the primary productivity of canopies, the associated fixation of atmospheric carbon dioxide, and the energy balance of the surface. It is one of the main inputs of Light Use-Efficiency (LUE) models to estimate biomass production.
Objective
The objective of the project is to develop a dataset and a processing chain for global, multi-decadal time series of LAI and FAPAR that is both ready for operational use, and that has demonstrated added value for the climate science community.
In the project we aim for the following innovations:
Maximizing the use of EO data: The final data sets will cover the global land mass for the period 2000-2021 at 1 km and 300m and will be based on the optimal joint retrieval of the following sensors:
- SPOT4/VGT1 and SPOT5/VGT2
- Terra/MODIS and Aqua/MODIS
- ENVISAT/MERIS
- Metop-A/B/C-AVHRR
- PROBA-V
- Sentinel-3/OLCI
- VIIRS
Using an innovative retrieval algorithm: A computationally efficient radiative transfer model inversion will make synergistic use of multiple satellite missions possible. After atmospheric correction, a coupled model for soil, snow, vegetation model and residual atmospheric effects will be used. The algorithm enables the optimal use of available data in a time window, and the quantification of uncertainties of the product.
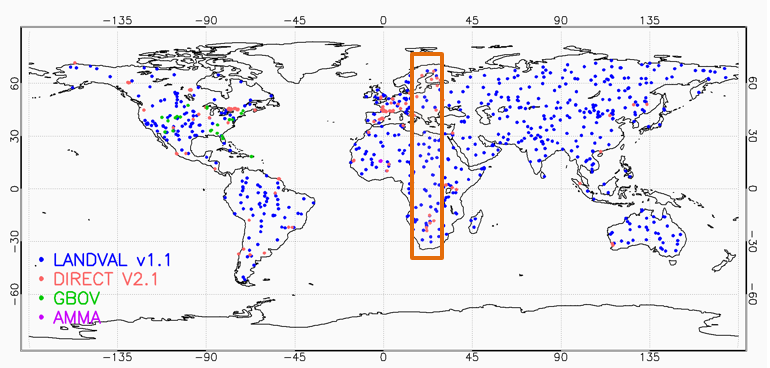
Maximising the use of validation data: The selected sites include the following locations for which ground data is available or which are representative of global conditions (see also Figure 4):
- Direct 2.1: 140 sites with ground data for specific campaigns, 2000-2021
- GBOV: 23 sites with multi-temporal ground data, 2013-2019
- AMMA: 13 sites with multi-temporal ground data, 2005-2015
- LANDVAL v1.1: 720 sites for product inter-comparison
- Sites defined by the Climate Research Group
Exploiting synergies with other ECVs: In two science studies the fitness of the data products will be evaluated for the modelling of light and water use efficiency, combined with other ECVs, and for the identification of the effects of temperature anomalies in time series. A feasibility study for the solar induced chlorophyll fluorescence (SIF) will investigate the possibilities of SIF as a complementary ECV.
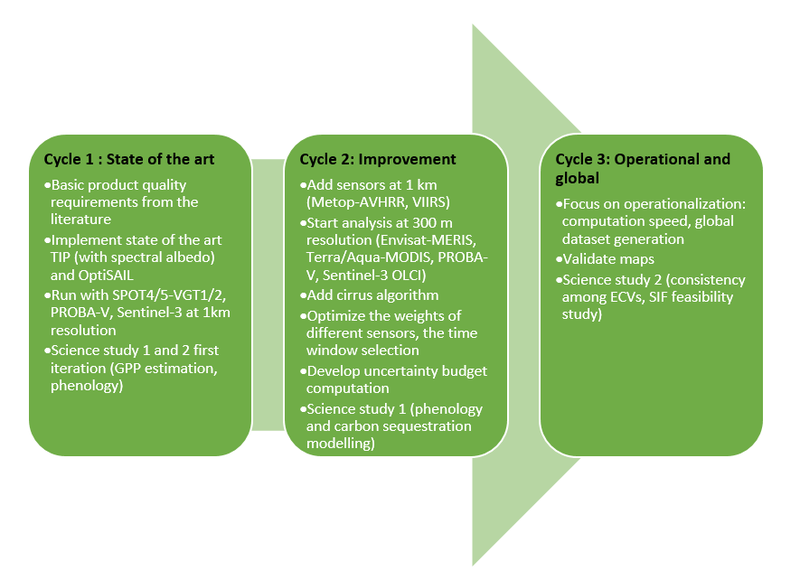
The project is organised in 3 cycles, focusing the development of the algorithm using state of the art tools, improvements by the progressive inclusion of more sensor data, and stepping up towards operational use. Science studies with the data will run in parallel to assess the scientific value of the products.

Vegetation Parameters Products
The VP CCI+ data sets will be made available via CEDA .
The figure below illustrates the general concept of the data sets produced during the three cycles of this project. It is organized with progressive inclusion of sensors, spatial and temporal coverage and resolution, with the dimensions of the test datasets (TDS) and climate research data packages (CRDP) illustrated. The initial emphasis is on the implementation of an innovative approach, gradually shifting towards selection and optimization for an operational context. The first cycle is distributed into an initial product validation and algorithm selection exercise, followed by the development of the baseline algorithm.

| Name | Cycle | Resolution | Sensors | ROI | Period |
|---|---|---|---|---|---|
| TDS-1 | 1 | 1000 m | SPOT4/5-VGT1/2, PROBA-V | Selected sites | 2019 |
| CRDP-1 | 1 | 1000 m | SPOT4/5-VGT1/2, PROBA-V | Selected sites + transect | 2000-2020 |
| CRDP-2 | 2 | 1000 m | SPOT4/5-VGT1/2, PROBA-V, Sentinel-3 OLCI, Metop-A/B/C-AVHRR, VIIRS | Selected sites + transect | 2000-2020 |
| TDS-2 | 2 | 300 m |
1. Terra/Aqua-MODIS, Envisat-MERIS 2. Terra/Aqua-MODIS, PROBA-V, Sentinel-3 OLCI |
Selected sites + transect |
1. 1 year (e.g. 2010) 2. 1 year (e.g. 2019) |
| CRDP-3 | 3 | 1000 m |
Selected sensors from: SPOT4/5-VGT1/2, PROBA-V, Sentinel-3 OLCI, Metop-A/B/C-AVHRR, VIIRS |
Global | 2000-2020 |
| CRDP-4 | 3 | 300 m |
Selected sensors from: Terra/Aqua-MODIS, Envisat-MERIS, PROBA-V, Sentinel-3 OLCI |
Global | 2000-2020 |
The data sets are further defined in the table below. The selected sites include the following locations for which ground data is available or which are representative of global conditions (see also Figure 4):
- Direct 2.1: 140 sites with ground data for specific campaigns, 2000-2021
- GBOV: 23 sites with multi-temporal ground data, 2013-2019
- AMMA: 13 sites with multi-temporal ground data, 2005-2015
- LANDVAL v1.1: 720 sites for product inter-comparison
- Sites defined by the CRG
The data sets are further defined in the table below.
CRDP-1
The first Climate Research Data Package (CRDP-1) is available on CEDA through this link.
Users should consult the Product User Guide for a correct usage of the data. The document is available on CEDA and also on this website under Key documents.
To faciliate and demonstrate the use of the data, 2 notebooks are available on the GitHub through https://github.com/Christiaanvandertol/VegetationCCI
This contains:
- A Jupyter Notebook to access, download and plot the data of a single tile, and to carry out a spatial aggregation
- A Jupyter Notebook to access, download and plot time series for a specific location from tiles
The Vegetation Parameters CCI+ project is carried out by a consortium of 7 companies/institutes from 6 ESA member states.
Project coordination
- University of Twente (UT), The Netherlands, Christiaan van der Tol is Science Leader
- VITO Remote Sensing, Belgium: Else Swinnen is Project Manager
Algorithm team
Validation team
- EOLAB, Spain, Lead: Fernando Camacho
Engineering team
- VITO Remote Sensing, Belgium, Lead: Michal Moroz
The Climate Research Group (CRG)
- Imperial College London (ICL), UK: Ian Colin Prentice, Catherine Morfoupoulos
- University of Antwerp (UA), Belgium: Manuela Balzarolo

Scientific Leader: Christiaan van der Tol
Project Manager: Else Swinnen
ESA Technical Officer: Clement Albergel
To run this example yourself, go to https://dashboard.climate.hub-otc.eox.at/. You can register for free.
Latest news & events

New Position: Junior Professional in AI for Climate Science
Opportunity for early-career Artificial Intelligence talent to join ESA’s Actionable Climate Information Section
Learn more
Working for ESA: procurement and proposal submission process
An Introduction to ESA Star - ESA's System for Tendering and Registration
Learn more
Climate Change & Cities: Open Competitive Tenders Launched
Two New City Research Calls On Urban Resilience To Climate Change Using Earth Observation Data
Learn more
ESA at COP29
ESA is participating in COP29 to highlighting satellites' role in tackling climate change
Learn more
Land Surface Temperature 2024 User Workshop Save the date: 5th and 6th December 2024
Call for abstracts and registration
Learn more
Call for new projects: Additional Essential Climate Variables
New R&D procurement as part of ESA's CLIMATE-SPACE programme
Learn more
Vegetation parameters: first data release
LAI and fAPAR data set spanning the years 2000-2020 available
Learn more
Open Competitive Tender for CLIMATE-SPACE Knowledge Exchange
ESA Tender Action Number: 1-12141. ESA Activity Number: 1000039650.
Learn more
Self-Supervised Learning for SAR; Benchmarking Datasets and Performance on Diverse Downstream Tasks
ESA Climate Office Research Fellow, Dr Anna Jungbluth, presents on 16 Dec at AGU2023
Learn more
Little Pictures winner announced at COP28
Results of Europe-wide climate data visualisation showcased
Learn more
New Tender: CROSS-ECV ACTIVITIES Tender Action Number: 1-12062
New tender issued by the ESA Climate Office (Activity Number: 1000039196)
Learn more

